House Valuation in De Laak, Eindhoven
Property valuation in De Laak, Eindhoven with CBS housing context, local checks, practical liveability and mortgage-report preparation.
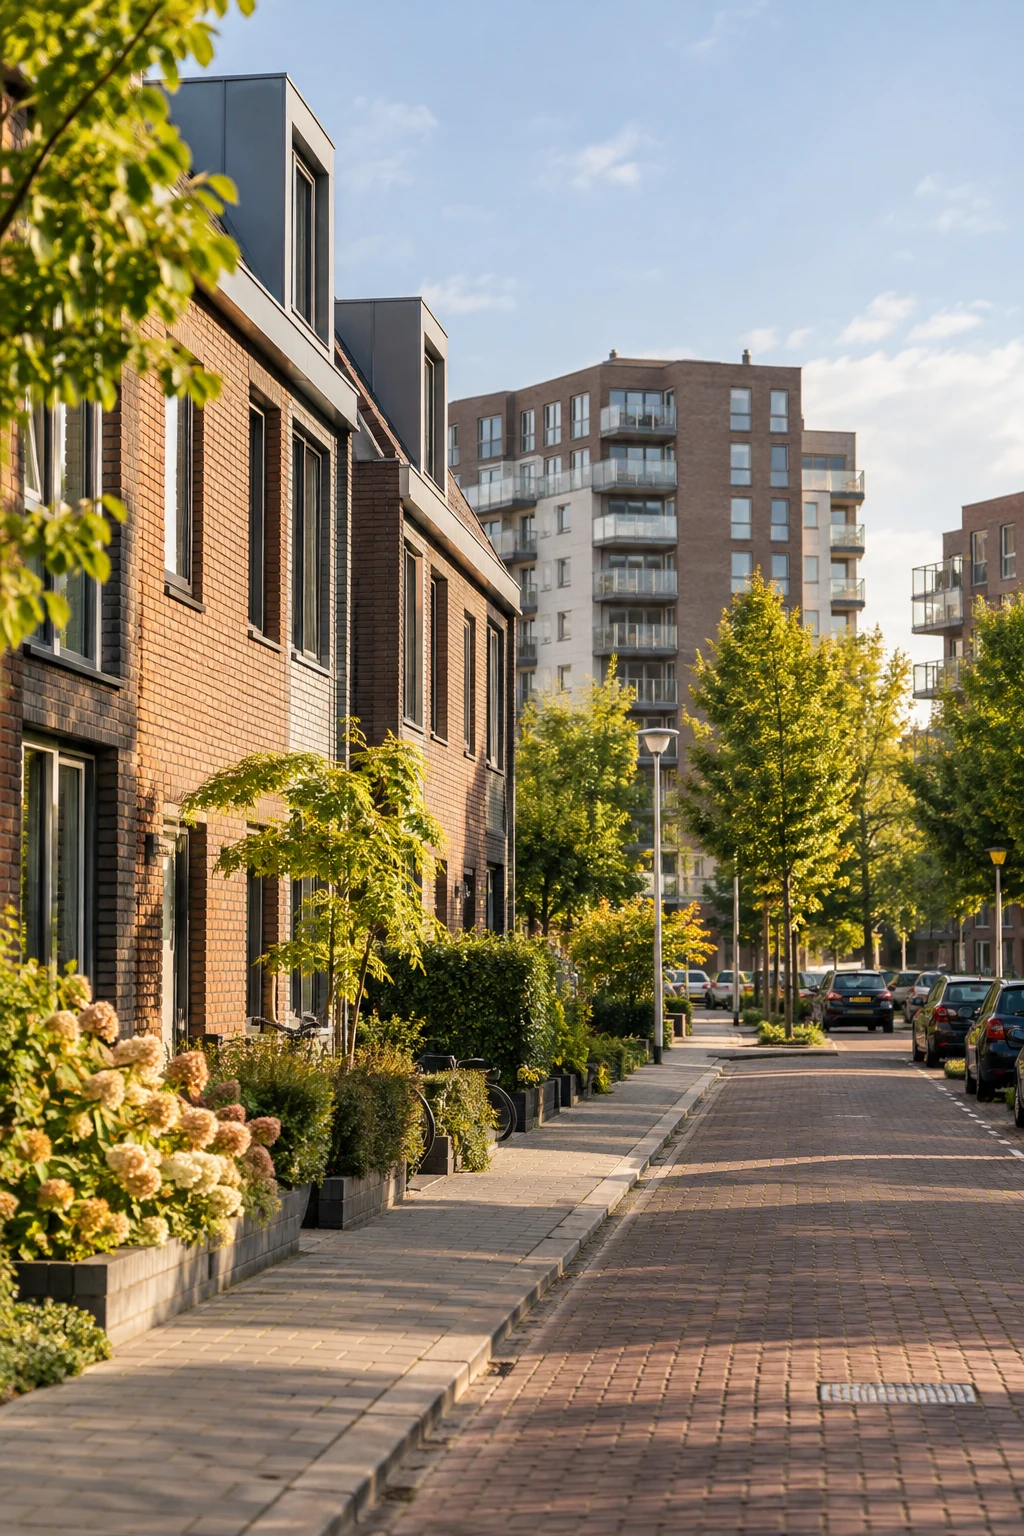
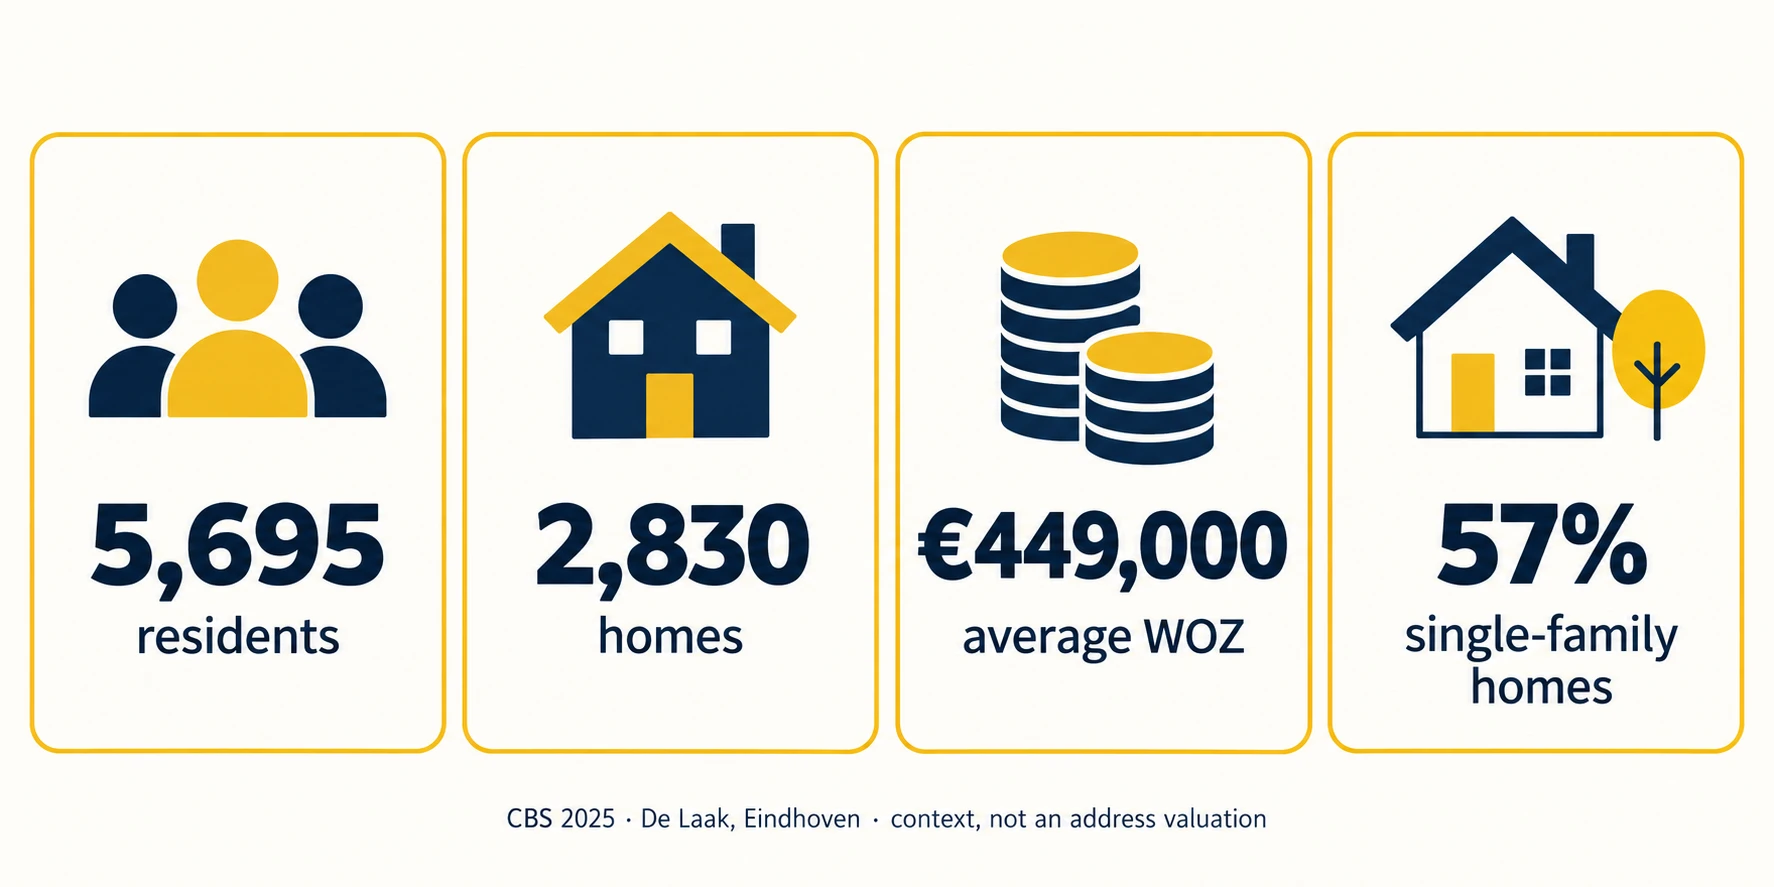
At a glance: A compact, urban mixed neighbourhood with family homes, apartments and a car-light daily pattern. The 2025 CBS row for De Laak records 5,695 residents, 3,165 households and 2,830 homes. Its average WOZ value is €449,000; 57% of homes are single-family and 43% multi-family, while 45% are owner-occupied and 55% rented. These are area statistics, not a valuation of one address. A compact boundary can combine different tenure types and building ages, making like-for-like evidence especially important.
Need a valuation in De Laak?
Share the property, mortgage purpose and deadline with Dirk-Jan. He will confirm the report type and next steps.

Local profile: De Laak
De Laak has 5,695 residents and 2,830 homes in the 2025 CBS Wijk row, with an average WOZ of €449,000. It is a compact, urban mixed neighbourhood with family homes, apartments and a car-light daily pattern. Within the Wijk, the named sub-areas already show a wide spread: Villapark has 2,475 residents and 1,177 homes, an average WOZ of €616,000, 58% single-family homes, 54% owner-occupied homes and Lakerlopen has 3,220 residents and 1,653 homes, an average WOZ of €330,000, 56% single-family homes, 39% owner-occupied homes. De Laak is small in area but not uniform. The valuation questions change between a quiet residential frontage, a busier route and a multi-family building with shared costs or parking rules. The area averages 0.8 cars per household, with a GP about 0.7 km away, a large supermarket about 0.7 km away, childcare about 0.5 km away and a primary school about 0.7 km away. Those figures help frame the search; the building, street, documents and comparable homes decide how the property should be valued.
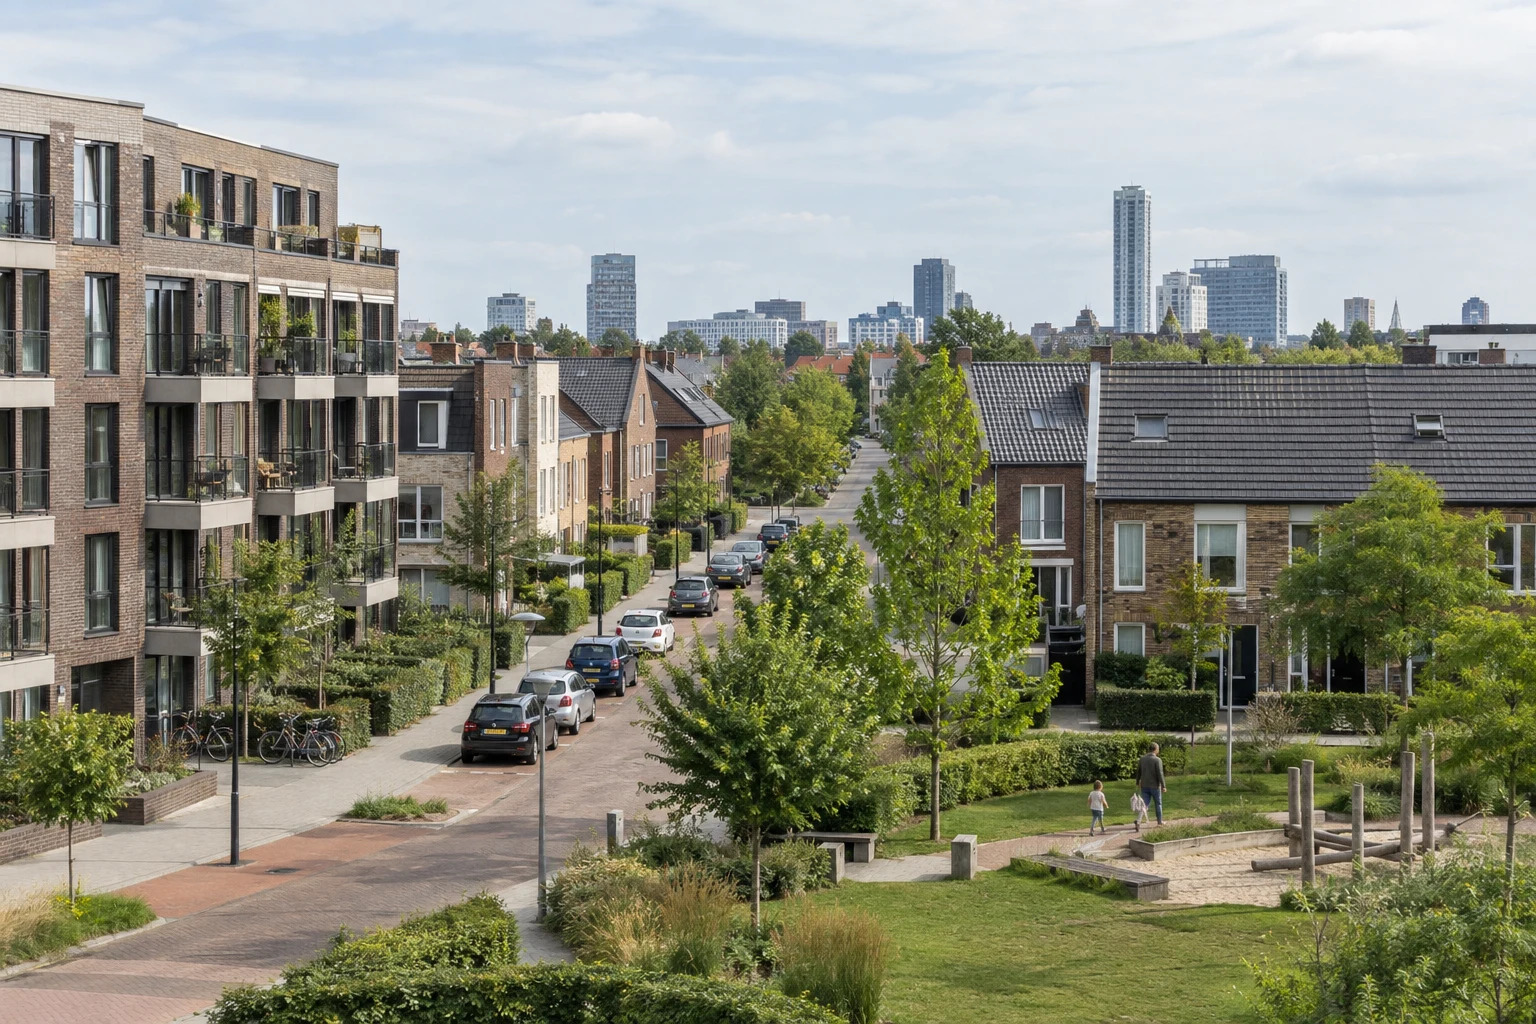
In practice, the streets around De Laak are not interchangeable: building type, access, outlook and condition can shift within a short distance. The address, the building and comparable homes carry the most weight in a valuation.
Best suited to: apartment buyers, young households, families and owners who value short trips to city services. Less suitable if: you need a guaranteed school place, a fixed commute, a particular parking outcome or a valuation based on an average alone.
| Local profile | De Laak |
|---|---|
| Statistical boundary | CBS Wijk De Laak (WK077231) is the statistical boundary used for these figures. |
| Population / households | 5,695 residents; 3,165 households (2025) |
| Housing stock | 2,830 homes; 57% single-family; 43% multi-family |
| Tenure | 45% owner-occupied; 55% rented |
| Local character | A compact, urban mixed neighbourhood with family homes, apartments and a car-light daily pattern. |
| Current market figures | Refresh live Funda listings before relying on asking price, €/m² or selling-time figures |
Your next step in De Laak
Your next step in De Laak
Local property market
De Laak at a glance
| Measure | CBS 2025 | What it tells you |
|---|---|---|
| Residents | 5,695 | Scale of the statistical area |
| Households | 3,165 | Household count, not a buyer count |
| Homes | 2,830 | Housing stock used for the CBS row |
| Average WOZ value | €449,000 | Tax-assessment context, not a market valuation |
| Single-family homes | 57% | Indicates the broad housing mix |
| Multi-family homes | 43% | Apartments and other shared buildings |
| Owner-occupied homes | 45% | Tenure signal, not a forecast of demand |
| Rented homes | 55% | Tenure signal and possible building-management differences |
| New homes recorded | 28 | CBS indicator; verify development status separately |
| Population density | 5,502 per km² | Average across the CBS area |
| Cars per household | 0.8 | Mobility context, not parking availability at one home |
The local figures in this guide use the 2025 CBS StatLine dataset for De Laak, alongside Eindhoven and national totals from the same source. They describe the area as a whole: its population, housing stock, tenure, density, proximity indicators and average WOZ. WOZ is a tax assessment for a defined geography and year, not the market value of one home. Read it alongside current asking-market signals and completed-sale evidence; it should never be copied into a mortgage report.
Local area compared with Eindhoven and the Netherlands
The comparison below keeps the geography and definitions visible. It is useful for orientation, not for ranking individual homes: the neighbourhood row is a Wijk statistic, the municipality row is Eindhoven as a whole and the Netherlands row is a national reference.
| Reference | Residents | Homes | Avg. WOZ (2025) | Single / multi | Owner / rented |
|---|---|---|---|---|---|
| De Laak | 5,695 | 2,830 | €449,000 | 57% / 43% | 45% / 55% |
| Eindhoven municipality | 249,035 | 121,191 | €391,000 | 58% / 42% | 44% / 56% |
| Netherlands | 18,044,027 | 8,274,478 | €398,000 | 63% / 37% | 57% / 42% |
A difference between the rows does not tell you what one address is worth. It tells you which questions deserve more attention: apartment documents in a multi-family area, plot and maintenance in a family-home area, or parking and access in a dense area.
Market evidence and limits
Funda’s neighbourhood pages provide a second lens on the local market. The table below records the pages checked on 8 September 2026, including current supply where shown, average asking price, average asking price per m², reported selling time and the number of homes sold in the previous twelve months. Use the linked neighbourhood pages to refresh the figures before relying on them.
The checked Funda pages show real variation inside the De Laak service area. Average asking prices in the priced sample run from €301,333 in Lakerlopen to €809,952 in Villapark, while average asking prices per m² run from €4,259 to €5,313. Where selling time is reported, the sample ranges from 25 days in Lakerlopen to 31 days in Villapark. These are asking-market signals based on the Funda pages checked on 8 September 2026; they are not completed-sale prices or an address valuation.
| Neighbourhood | Current supply | Average asking price | Average asking price per m² | Average selling time | Sold in previous 12 months |
|---|---|---|---|---|---|
| Lakerlopen | 15 | €301,333 | €4,259/m² | 25 days | 57 homes |
| Villapark | 10 for sale; 43 for rent | €809,952 | €5,313/m² | 31 days | 34 homes |
These are asking-market signals, not completed-sale evidence. The sample can mix apartments, family houses, new-build units and different streets. A lender-ready valuation still needs the address, inspection, legal documents and suitable completed comparables.
| Market question | What to verify now | Why it matters for a valuation |
|---|---|---|
| Asking price | Current Funda listings and their asking history | Asking price is a seller signal, not a completed transaction |
| Price per m² | Same property type, floor area and condition | A mixed sample can make €/m² misleading |
| Selling time | The live sample and its definition | One listing period is not a promise for another home |
| Completed sales | Recent, comparable transactions from the valuer’s evidence set | Lenders rely on suitable evidence for the individual address |
| WOZ | Correct CBS boundary and valuation year | WOZ supports context but has a different purpose and date |
Reading the numbers in context
The €449,000 average WOZ figure sits inside a housing mix of 57% single-family and 43% multi-family homes. That combination can hide very different homes: an apartment with a service charge, a terraced family home, a renovated older property and a newer unit are not interchangeable. The 45% owner-occupied share and 55% rental share also point to different maintenance, VvE and buyer questions.
Three decisions to make before using a headline
First, decide what the number is for. A buyer may be testing an offer, an owner may be refinancing, and a lender may require a report with specific validation wording. Second, decide which geography is relevant. CBS Wijk De Laak (WK077231) is the statistical boundary used for these figures. A national or city-wide average can provide context, but it cannot replace the street, building and postcode evidence. Third, decide which differences are material. In De Laak, that can mean an apartment service charge, a family-house extension, an older roof, a permit question, a parking right, an energy system or exposure to a busy route.
Keep the listing URL and check date beside the asking figure, and record the CBS table, code and data year beside the WOZ figure. For each comparable, record the area, plot, build period, energy label, condition and legal position. If a field cannot be verified, flag it for follow-up. A clear note about what is missing is safer than a precise-looking number assembled from incompatible sources.
What a comparable should explain
| Comparable check | Address-level question |
|---|---|
| Housing type | Is it the same apartment, terraced, semi-detached or detached form? |
| Size and layout | Is NEN 2580 living area measured consistently, with the same bedrooms and storage? |
| Building and year | Do construction, renovation and installations match? |
| Condition and energy | Are label, glazing, insulation, heating and renovation evidence comparable? |
| Micro-location | Does it face the same route, park, school, industrial edge or quiet street? |
| Legal and shared costs | Are title, VvE, parking, easements and restrictions similar? |
What drives value in De Laak
Housing form, plot and condition
The local profile is a starting point, not the answer. In De Laak, a valuer should separate property type, living area, plot, gardens, extensions, parking, energy performance, building maintenance and legal status. A compact boundary can combine different tenure types and building ages, making like-for-like evidence especially important.
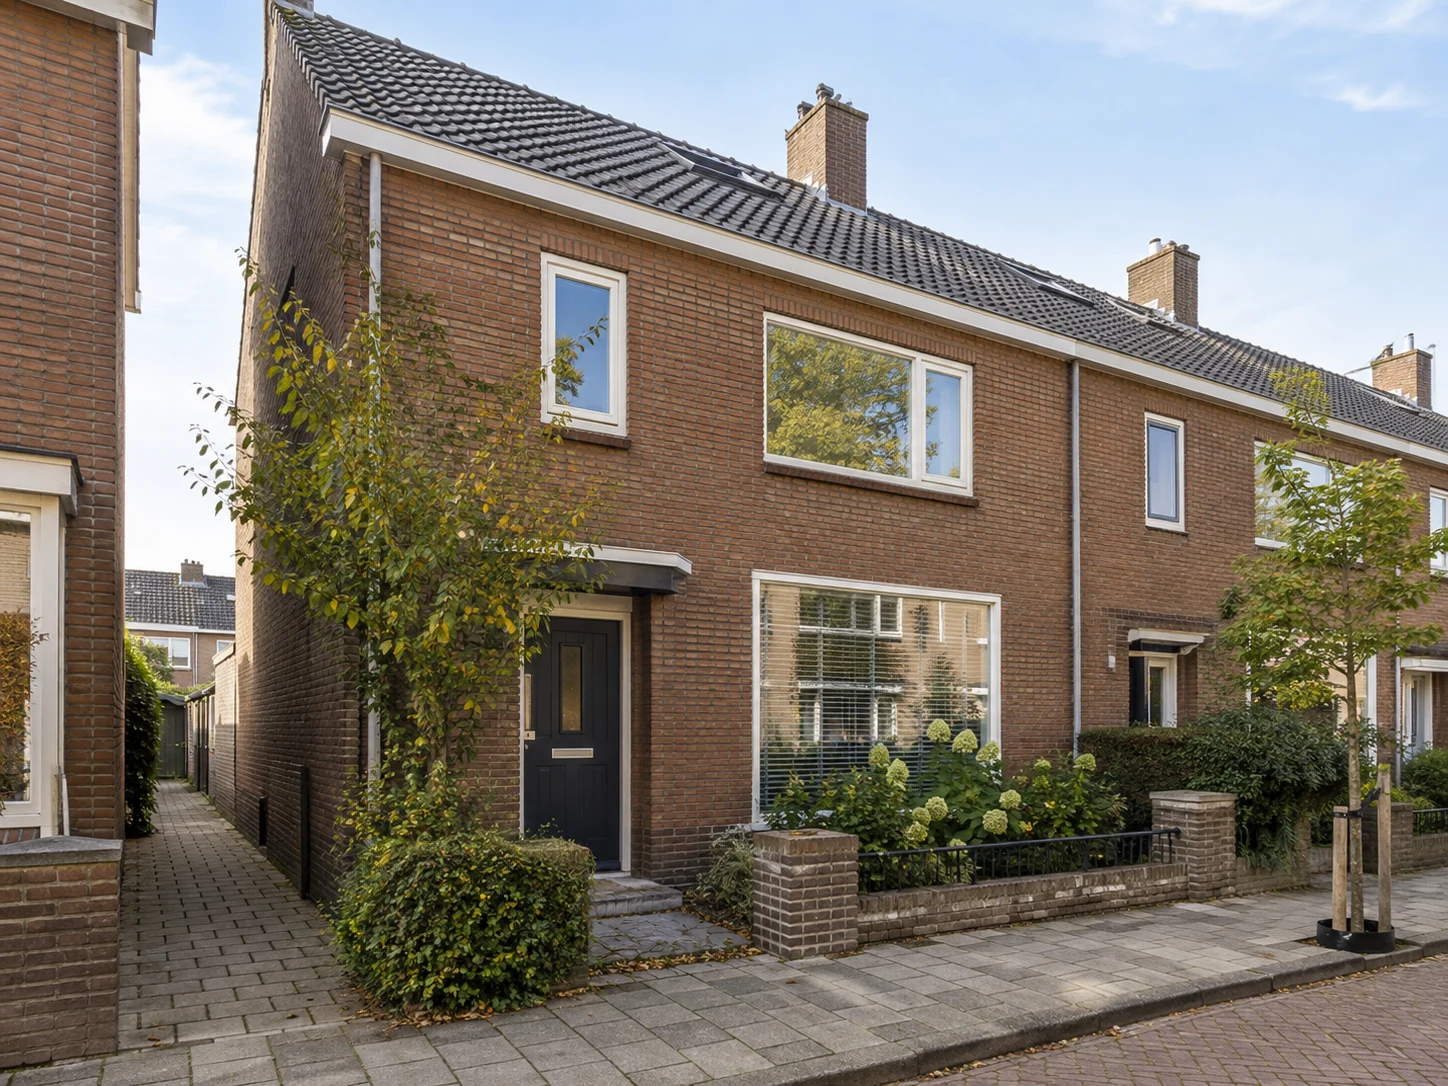
Housing around De Laak needs to be compared by form, floor area, condition, energy performance and street setting. Those details determine whether a nearby home is genuinely comparable.

| Value factor | Local signal | What to document |
|---|---|---|
| Living area and layout | Mixed housing stock within the CBS row | Floor plans, NEN 2580 measurement and room use |
| Plot and outside space | Street and edge conditions differ | Cadastral plan, garden, balcony, storage and parking rights |
| Condition | Older and newer homes can sit within one boundary | Renovation invoices, defects, maintenance and inspection results |
| Energy | Label and systems affect comfort and running costs | Current label, insulation, glazing, ventilation and heating |
| Shared building costs | Relevant to apartments and shared developments | VvE minutes, MJOP, reserve fund, insurance and fee |
| Legal position | Title, permits and use restrictions can change financeability | Deed, permits, easements, lease and lender wording |
Micro-location checks
Visit the property at more than one time of day. Compare the bedroom side, living-room outlook, pedestrian and cycle routes, parking, deliveries, street lighting, construction and nearby open space. De Laak is small in area but not uniform. The valuation questions change between a quiet residential frontage, a busier route and a multi-family building with shared costs or parking rules. These observations should be recorded as address-level checks rather than turned into a blanket claim about the whole neighbourhood.
- Check the exact street and building entrance, not only the postcode label.
- Confirm whether parking is owned, leased, permitted or public.
- Read planning information for nearby construction, traffic, green space and redevelopment.
- Check noise, air, heat, water and soil with the address-specific maps at Atlas Leefomgeving.
- Use the current Police Mijn Buurt map) as a recorded-incident tool, not as a universal safety score.
Living in De Laak
Everyday character
A compact, urban mixed neighbourhood with family homes, apartments and a car-light daily pattern. Everyday convenience depends on the exact street: the CBS averages place the GP at about 0.7 km, a large supermarket at 0.7 km, childcare at 0.5 km and a primary school at 0.7 km. These are area averages, not a guarantee for a particular home or service provider.
Families, schools and childcare
The CBS row counts about 12.2 schools within 3 km and an average primary-school distance of 0.7 km. That helps describe proximity, but it does not guarantee a place, school quality, admission outcome or childcare capacity. Families should check the exact school route, current enrolment information, cycling safety, childcare availability and the weekly travel pattern before relying on the location.
Expat context
For an international household, De Laak can be practical if the address works for the Brainport commute and the household is comfortable arranging Dutch administration. The useful checks are the lender’s documents, school language, childcare, transport and the building or neighbourhood rules. A local valuation report still needs the same legal and property evidence regardless of the buyer’s nationality.
Families and children
For families, the CBS distance indicators are a starting point: a primary school is about 0.7 km away on average and the row counts about 12.2 schools within 3 km. The useful decision is more specific than proximity. Check the actual school route, crossings, cycling safety, childcare intake, after-school arrangements and the time required on a normal weekday. The guide does not promise a place or an admission outcome.
| Family check | Why it matters in De Laak | Address-level action |
|---|---|---|
| School route | Average distance can hide crossings, traffic and barriers | Walk or cycle at the time the child will travel |
| Childcare | Capacity and opening hours change | Check current providers and waiting lists |
| Outdoor time | Park, green edge and play space affect daily use | Inspect sight lines, access and evening lighting |
| Home layout | Bedrooms, storage, garden and stairs shape family use | Match the floor plan and measurements to the inspection |
| Travel pattern | Work, school and care trips may pull in different directions | Test the weekly pattern, not one off-peak journey |
Safety and liveability
Recorded incidents, perceived safety and the experience of one address are different measures. Use current police and municipal tools for the postcode, then walk the route between the property, parking, school, station or shops at the times you will use it. Lighting, traffic, active frontages, building access and evening activity can matter more than an area-wide count.
Safety and environment checks
| Evidence layer | What it can tell you | What it cannot prove |
|---|---|---|
| Police Mijn Buurt | Recorded incidents around the selected postcode | The experience of one street or future safety |
| Municipal safety information | Current local priorities and interventions | A universal score for every building |
| Atlas Leefomgeving | Noise, air, heat, water and soil indicators | The condition inside the home or a final planning decision |
| Walk-through | Lighting, traffic, access, activity and building entry | A replacement for official data or a specialist inspection |
Getting around
Eindhoven’s municipal mobility and public-transport pages should be checked for current routes, works, parking rules and shared-mobility hubs. The CBS car figure of 0.8 per household describes the statistical area; it does not establish that a particular apartment has a parking space. A live journey planner is the right source for a current commute, and the valuer should note any material road, rail, cycling or construction exposure.
| Daily-route question | Evidence to collect | Why it belongs in the decision |
|---|---|---|
| Walking and cycling | Actual door-to-school, shop and stop route | The map distance may omit crossings, barriers or traffic |
| Public transport | Current operator route and accessibility information | Timetables and works change |
| Parking | Deed, allocation, permit, paid or public arrangement | A car average is not a parking right |
| Brainport commute | Live planner at the household’s travel time | A headline location can hide peak-time friction |
Amenities and leisure
Local shops, parks, sports, healthcare, cafés and schools contribute to liveability, but proximity and opening hours change. Check the municipal neighbourhood information and the exact walking or cycling route. The most useful valuation distinction is often whether a home faces a quiet residential side, a busy route, a school, a green edge or an active commercial setting.
Costs beyond the price
| Cost area | What belongs in the household budget | What to verify before purchase |
|---|---|---|
| Valuation fee | Standard residential report: €599 all-in in the normal service area | Confirm lender purpose, NWWI/NHG wording and deadline |
| Optional urgency | 24-hour option can add €60 when planning, access and validation allow | Confirm availability before relying on the timing |
| Ownership costs | Mortgage, transfer tax, notary, advice, insurance and municipal charges | Ask the adviser for current tax and finance assumptions |
| Energy and maintenance | Heating, insulation, repairs, facade, roof and installations | Review label, invoices, inspection and expected works |
| Apartment / VvE | Service fee, reserve fund, MJOP and planned capital works | Read minutes, accounts, insurance and arrears |
| Mobility | Parking, public transport, bicycles, fuel and travel time | Budget for the household’s actual weekly pattern |
A valuation fee is only one part of the purchase budget. A report can support a mortgage decision, while the lender still decides whether and on what terms to lend.
Documents to request before the inspection
A well-prepared file makes it easier to distinguish what is visible at the inspection from what must be verified in a deed, drawing, invoice or municipal record. The list below is deliberately practical: not every item applies to every home, but missing information should be recorded rather than guessed.
| File or document | What to look for in De Laak | Why the valuer may need it |
|---|---|---|
| Purchase agreement | Address, price, conditions, inclusions and any unusual clauses | Confirms the stated purpose and what is being bought |
| Floor plans and measurement report | Living area, storage, extensions, balconies and layout | Prevents a comparison of different area definitions |
| Cadastral and title information | Parcel, ownership, easements, leasehold or restrictions | Legal position can affect use, marketability and financeability |
| Energy label and installations | Label date, heating, ventilation, glazing and insulation | Documents comfort and running-cost evidence |
| Renovation invoices | Scope, contractor, date, permits and warranties | Separates documented improvements from unverified claims |
| Permits and drawings | Extensions, dormers, conversions, splits and use changes | Confirms whether the physical home matches its legal use |
| VvE pack where relevant | Minutes, MJOP, reserve fund, insurance, fee and arrears | Shared maintenance and future costs can change apartment value |
| Parking and storage evidence | Deed, allocation, garage, permit, bicycle room and charging rights | A nearby public space is not the same as owned parking |
| Ground, water and environmental reports | Soil, foundation, water, noise, air and heat information | Address-level conditions can change comfort and risk |
| Rental or occupancy information | Tenancy, notice, use restrictions and income if relevant | A valuation purpose may treat occupation differently |
| Lender or adviser wording | NWWI, NHG, report purpose, validation and deadline | Determines which report and evidence are acceptable |
If a document is unavailable, note that fact in the request rather than substituting a town average. For older homes, extensions, apartments and properties near planned works, the missing document can be more important than another generic market headline.
Address-level planning, environment and safety checks
The municipality and national map tools describe the setting, not the outcome for one address. Use them to ask better questions: is the route changing, is a new building approved or only proposed, and does the home sit beside a source of noise, heat, water or traffic?
| Check | Source to consult | Question for the address |
|---|---|---|
| Zoning and permits | Eindhoven municipal planning and permit information | Does the existing home and any extension match the permitted use? |
| New construction | Municipal housing and project information | Is the project adopted, permitted, funded or still a concept? |
| Road and cycle changes | Municipal mobility pages | Could access, parking, sound or crossing patterns change? |
| Rail and bus exposure | Operator and municipal public-transport pages | What is the real walking route and what activity occurs beside it? |
| Noise | Atlas Leefomgeving and municipal maps | What is the exposure at the facade, garden and bedrooms? |
| Air quality | Atlas Leefomgeving and municipal measurements | Does ventilation or a busy route need closer attention? |
| Heat and water | Atlas Leefomgeving | Are paving, shade, drainage and water exposure relevant? |
| Soil and foundation | Atlas Leefomgeving, municipal records and inspection | Is there a reason to request a specialist report? |
| Recorded incidents | Police Mijn Buurt map | What is recorded around the postcode, and how current is it? |
| Everyday route | A visit at weekday, evening and weekend times | Does the lived experience match the buyer’s expectations? |
Recorded incidents, environmental indicators and planning information are evidence inputs, not promises. A busy street can be convenient and still need a noise check; a quiet-looking edge can still have a drainage, soil or access question. Keep the observation, source date and address together in the file.
Transport and the daily-route test
The CBS distance measures below are averages. They are useful for orientation, but they do not tell a household how long a school run, station walk, hospital trip or Brainport commute will take from one front door. Test the actual weekly routine before treating location as a premium.
- Walk from the property to the nearest relevant bus, rail, cycle or shared-mobility connection.
- Check the route at the time the household will use it, including lighting, crossings, school traffic and weather exposure.
- Separate owned parking, a permit, public paid parking and informal parking; they have different legal and cost implications.
- Confirm bicycle storage, charging, lift access and the distance between parking and the entrance.
- Use a live journey planner for current schedules; do not copy an old timetable into a valuation report.
- Check municipal roadworks, development and parking-policy pages after a material change.
- Note whether a route is beside rail, an event venue, a school, a commercial edge or a quiet courtyard.
- Budget the time and cost of the actual household pattern, not an area-wide car average.
For international buyers, transport is often where an attractive headline location becomes a practical trade-off. A home that is close to employment may still have a difficult school, airport or weekend route. Record the route evidence and keep it separate from the property’s physical valuation.
Comparable-selection worksheet
A comparable earns its place when the differences can be explained. Use the checks below to decide whether a sale belongs in the same evidence set; the final report still depends on suitable completed-sale evidence.
| Comparison field | Subject home | Comparable to accept | Comparable to question |
|---|---|---|---|
| Property form | Record exact type and building setting | Same form and similar buyer pool | Different form or shared structure |
| Living area | Confirm NEN 2580 and usable layout | Similar measured area and layout | Different area definition or unusual room use |
| Plot / outside space | Garden, balcony, roof terrace, storage | Similar privacy and outdoor utility | Larger plot, unusual rights or no outside space |
| Construction / renovation | Year, conversion, extension and works | Similar quality and remaining life | Major renovation, monument or new-build gap |
| Energy and comfort | Label, glazing, heating and ventilation | Similar documented performance | Unverified claim or materially different systems |
| Location | Street, route, outlook and noise | Same micro-setting and access | Park edge, commercial edge, rail or traffic difference |
| Tenure / legal | Freehold, lease, VvE and restrictions | Similar title and use rules | Different legal or letting position |
| Parking / storage | Owned, allocated, permitted or public | Same practical arrangement | A parking right not included in the subject |
| Market date | Transaction or listing date | Current and close enough to the valuation date | Stale evidence without adjustment |
| Purpose | Purchase, refinance, divorce or other | Evidence fit for the stated purpose | Generic comparison with no purpose match |
A sale in another Eindhoven neighbourhood can be helpful when housing form and buyer pool match, while a sale next door can be weak when the building, title, renovation or outlook differs. Record why a comparable was selected and which differences were adjusted or left unresolved.
Purpose-specific preparation
Purchase: send the purchase agreement, lender wording, floor plans, energy evidence and known defects before the inspection. The valuer needs to know whether the requested report is for a new purchase, a bridge, a refinance or another purpose.
Sale: a market guide can help explain buyer questions, but an asking price is not a mortgage valuation. Keep marketing strategy, current condition and completed-sale evidence separate. A seller should document improvements rather than rely on a neighbourhood headline.
Refinance or equity: confirm the lender’s accepted report type and the relevant valuation date. Changes to the home, title, energy systems, VvE, leasehold or planning context since purchase should be documented.
Divorce, inheritance or internal transfer: establish the valuation purpose, date and parties who will rely on the report. A different purpose can require different assumptions, evidence and instructions even at the same address.
What a strong local report should make clear
A useful report should make its geography, valuation date, purpose, property description, evidence, adjustments and limitations readable. For De Laak, record the boundary used for the figures and explain how the local housing mix and street setting affect the comparable selection.
- Which CBS, municipal or service-area boundary was used.
- Which market measure is an asking-price signal, a WOZ assessment or a completed transaction.
- Why each comparable is similar and where it differs.
- Which documents were inspected, supplied, missing or still to be verified.
- How condition, energy, VvE, title, parking, planning and micro-location affect the conclusion.
- Which statements are observations and which are conditional interpretation.
- The report purpose, lender wording, validation and deadline.
- The checks the client should repeat if the transaction or planning context changes.
Use this guide to understand the area, then commission an address-level report for the agreed purpose. That report turns the available evidence into a professional conclusion for the specific home.
Neighbourhoods and boundaries within De Laak
CBS Wijk De Laak (WK077231) is the statistical boundary used for these figures. For De Laak, the practical service area and the CBS statistical boundary are not always identical. Record the postcode, municipality, neighbourhood, building and micro-location before choosing evidence.
CBS lists 2 named neighbourhoods within this Wijk. They are not a price league table; they show how housing mix, tenure and building context can vary inside the wider label.
| CBS neighbourhood | Residents / homes (2025) | Average WOZ | Housing mix | Tenure | What to check at the address |
|---|---|---|---|---|---|
| Villapark | 2475 residents; 1177 homes | €616,000 | 58% single-family; 42% multi-family | 54% owner-occupied; 46% rented | Check the exact building, street, plot and legal position |
| Lakerlopen | 3220 residents; 1653 homes | €330,000 | 56% single-family; 44% multi-family | 39% owner-occupied; 61% rented | Check the exact building, street, plot and legal position |
| Local distinction | Buyer question | Valuation implication |
|---|---|---|
| Established residential streets | Is the home on a quiet side street or a traffic route? | Choose comparables with similar sound, access and outlook |
| Apartment-led pockets | Are lift, storage, balcony, parking and VvE documents comparable? | Shared costs and legal structure affect value |
| Green or edge setting | Does the address border a park, open land or a route? | Outlook and environmental exposure need exact checks |
| Redevelopment or recent homes | Is the project completed, permitted or still planned? | Do not treat a plan or headline as a completed amenity |
Market outlook
The outlook below is a decision aid, not a forecast. It separates observed CBS indicators from the address-level checks that still have to be made.
| Driver | Evidence for this area | What it may change | Confidence / next check |
|---|---|---|---|
| Housing mix | 57% single-family and 43% multi-family in the CBS row | A nearby home is only comparable when form and buyer pool match | High for the 2025 dataset; confirm the property type |
| Tenure | 45% owner-occupied and 55% rented | VvE, maintenance and buyer pool can differ by building | High for the row; inspect the title and building file |
| Recent housing | 28 homes recorded from the last ten years | Newer stock or works can alter supply and evidence | Directional; verify municipal delivery and permits |
| Density and setting | 5,502 residents per km², a mixed urban setting | Noise, parking, outlook and travel exposure can vary sharply | Address-level; use a visit and environment maps |
| Mobility | 0.8 cars per household; local services at CBS averages | Parking, cycling and commute costs influence liveability | Address-level; use live operator and municipal pages |
| Market measures | WOZ €449,000; refresh current Funda listings for asking-price and €/m² evidence | Keep tax assessments, asking signals and completed sales separate | Refresh before relying on a current comparison |
Is De Laak a good place to buy?
De Laak can suit apartment buyers, young households, families and owners who value short trips to city services. The trade-off is that a compact boundary can combine different tenure types and building ages, making like-for-like evidence especially important. A sensible decision combines the home’s condition, tenure, transport, monthly costs, legal position and likely time horizon. For a mortgage, the report purpose and lender wording should be confirmed before the inspection.
Before you rely on a valuation
- Compare like with like: property type, area, plot, condition, energy label, tenure, outdoor space and micro-location.
- Keep asking prices, WOZ and completed-sale evidence in separate columns.
- Check title, permits, easements, land use, VvE documents and parking rights.
- Verify floor area, energy documents, renovation evidence and the actual building condition.
- Check exact-address noise, air, heat, water, soil, safety and nearby planning.
- Preserve the lender’s wording and deadline; NWWI, NHG and report-purpose requirements can change.
- Treat this guide as context. A lender-ready report assesses the specific home on the agreed valuation date.
Where the numbers come from
CBS provides the 2025 population, housing, tenure, density and WOZ context. Funda provides dated asking-market figures. Municipal, police and Atlas Leefomgeving pages cover travel, parking, planning, safety and environmental checks. These measures answer different questions, so keep each figure beside its date and geography when you compare a home.
Geography: CBS Wijk De Laak (WK077231) is the statistical boundary used for these figures. The service-area label, statistical row and address may differ, especially where a proxy represents the wider service area.
Update policy: Recheck Funda listing evidence monthly or quarterly, CBS/WOZ when the annual table is released, and municipal planning, transport, safety, school and environmental tools after material change. The CBS figures are from 2025 and the market information was refreshed in September 2026.
Compare De Laak with nearby guides
Property valuation guide for Tongelre
Tongelre has a different boundary, housing mix or tenure profile from De Laak. Open the guide for its CBS geography and practical checks.
Use the comparison to frame questions about housing type, condition, energy, parking, transport and legal documents; do not treat either area average as a valuation of the address.
Property valuation guide for Oud-Tongelre
Oud-Tongelre has a different boundary, housing mix or tenure profile from De Laak. Open the guide for its CBS geography and practical checks.
Use the comparison to frame questions about housing type, condition, energy, parking, transport and legal documents; do not treat either area average as a valuation of the address.
Property valuation guide for Doornakkers
Doornakkers has a different boundary, housing mix or tenure profile from De Laak. Open the guide for its CBS geography and practical checks.
Use the comparison to frame questions about housing type, condition, energy, parking, transport and legal documents; do not treat either area average as a valuation of the address.
Relevant guides and next step
- Request a mortgage valuation in De Laak when you have the address, lender wording and deadline.
- Property valuation services in Eindhoven for the standard fee, scope and report timing.
- About Cheetah Valuations and Dirk-Jan for the appraiser’s professional background.
- Documents needed for a mortgage valuation in the Netherlands before the inspection.
- Visit the Eindhoven property valuation comparison hub to compare the wider service area.
FAQ
What does the CBS WOZ value say about a home in De Laak?
CBS records an average WOZ value of €449,000 for the disclosed De Laak row in 2025. This is a tax assessment for a defined geography and year. It provides context, but it should not be copied into a mortgage report or treated as the market value of one address.
How should I compare a home in De Laak with another Eindhoven neighbourhood?
Start with the same housing type, living area, condition, energy performance, tenure, parking and micro-location. A compact boundary can combine different tenure types and building ages, making like-for-like evidence especially important, so a nearby sale may still be a weak comparable.
Are schools and childcare guaranteed by the local averages?
No. The CBS row places a primary school about 0.7 km away on average and counts about 12.2 schools within 3 km. Check current admission, school route and childcare availability for the exact address.
Does De Laak have a fixed parking outcome?
No. The area car figure is 0.8 cars per household, but that does not establish a parking space, permit or garage for one property. Confirm the deed, lease, permit rules and the current municipal parking position.
What should I send for a mortgage valuation in De Laak?
Send the address, purpose, lender wording, deadline, purchase agreement if available, floor plans, energy documents, renovation information, VvE documents and any permits. The valuer can then confirm what is relevant before the inspection.
How current are the market figures?
The CBS figures are for 2025. Refresh the Funda listing page for current inventory and asking prices before making a market decision.
Why do the named neighbourhoods within De Laak matter?
They show how housing mix, tenure and building context can change inside the disclosed CBS Wijk. They are not price rankings. Use the named row to choose better questions, then match the exact property, street, documents and comparable evidence.
Which local checks should I repeat before signing?
Repeat the address-level checks that can change: title and permits, floor area, energy evidence, VvE documents, parking rights, noise, air, water, soil, planning, school or childcare routes and the lender’s report wording. A new plan, inspection finding or missing document can change the evidence set.