Property valuation in Eindhoven: compare neighbourhoods and North Brabant towns
This property valuation in Eindhoven guide compares Eindhoven neighbourhoods and North Brabant towns by housing mix, dated asking-market evidence, WOZ context and practical decision factors. Start with the places that fit your priorities, then open the guide for the address and housing type you are considering.
Compare the area, then value the address
Dirk-Jan Bonenkamp prepares residential valuation reports for homes around Eindhoven. Share the address, purpose and lender wording so the report matches the property you are financing.

Eindhoven in the regional picture
Eindhoven’s city-wide averages sit inside a wider North Brabant housing system. Density, tenure and housing type help explain why a centre apartment, a planned district and a village home can have very different evidence.
How to use this: A Funda check on 23 August 2026 showed 1,490 active Eindhoven listings, including 553 houses, 922 apartments and 521 new-build listings. Treat that count as dated inventory. Completed-sale evidence and an address-level valuation require separate checks.
For a city-level sense check, the same CBS WOZ table places Amsterdam at €518,000, Utrecht municipality at €490,000 and Rotterdam at €342,000 in 2025. Use these as comparison rows for different housing systems, then compare Eindhoven with a like-for-like home.
Three scales help you read the market
The city row shows the urban baseline. The North Brabant row shows the province. Individual guide pages add neighbourhood boundaries, housing mix and dated asking-market examples. Read them together when a move crosses from an apartment-led district into a family suburb or village.
North Brabant, Brainport and housing supply
North Brabant had approximately 1,213,500 homes at the start of 2026. The provincial series reports housing-stock growth of 26.6% since 2000, population growth of 13.6% and average household occupancy of 2.2. The provincial monitor follows permits, plan supply and capacity indicators and is updated quarterly.
City centre
Central Eindhoven and Strijp-S are apartment-led and amenity-rich. Check VvE finances, parking, floor level, noise and redevelopment.
Brainport edge
Veldhoven, Meerhoven, Best, Son en Breugel and Wintelre combine employment access with different family-housing and transport choices.
Village network
Heeze, Sterksel, Leende, Nuenen and the Kempen villages trade city proximity for different plot, service and small-market contexts.
Brainport Eindhoven covers 21 municipalities. Use the regional map to understand that geography, and check a live planner for an actual address rather than relying on a generic commute label.
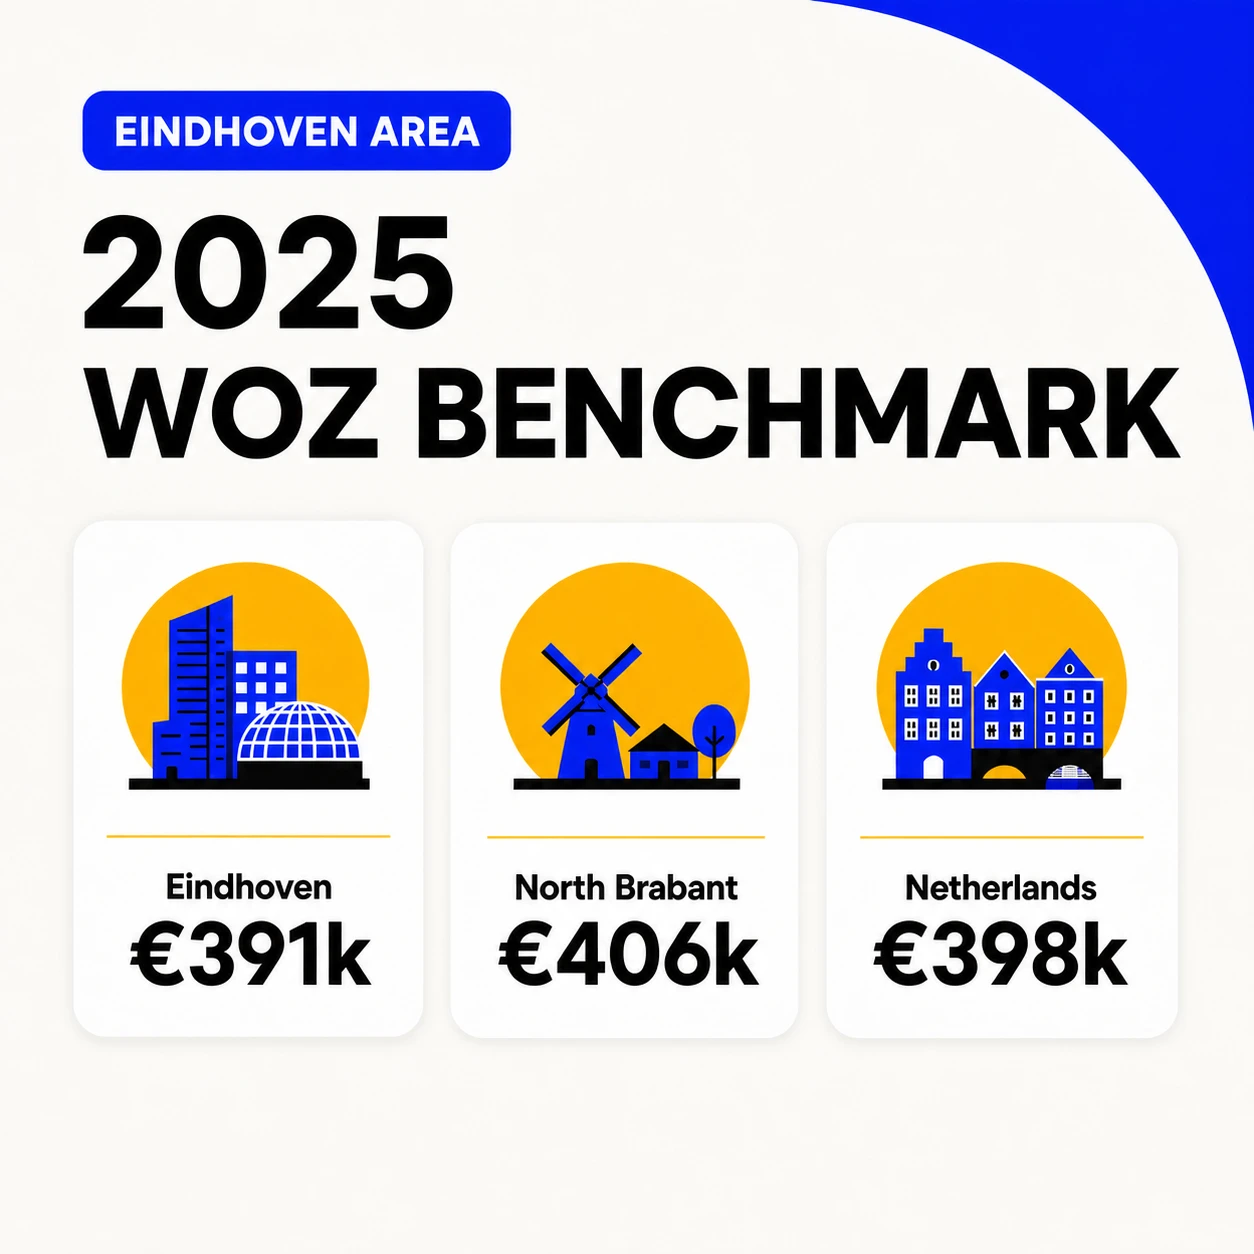
2025 WOZ benchmark across the region
Netherlands
- Average WOZ
- €398,000
- Use it to compare
- National reference row
North Brabant
- Average WOZ
- €406,000
- Use it to compare
- Province-wide reference row
Eindhoven
- Average WOZ
- €391,000
- Use it to compare
- Dense city municipality with mixed housing
Waalre
- Average WOZ
- €531,000
- Use it to compare
- Green south-of-Eindhoven municipality
Veldhoven
- Average WOZ
- €480,000
- Use it to compare
- Brainport municipality
Oirschot
- Average WOZ
- €503,000
- Use it to compare
- Historic-town municipality
Son en Breugel
- Average WOZ
- €541,000
- Use it to compare
- Village municipality
Maarheeze (Cranendonck row)
- Average WOZ
- €419,000
- Use it to compare
- Rail-served village context
Limburg
- Average WOZ
- €311,000
- Use it to compare
- Lower-WOZ provincial comparator
North Holland / Utrecht provinces
- Average WOZ
- €480,000
- Use it to compare
- Higher-WOZ provincial comparators
Amsterdam municipality
- Average WOZ
- €518,000
- Use it to compare
- Higher-WOZ city comparator
Utrecht municipality
- Average WOZ
- €490,000
- Use it to compare
- City comparator; separate from Utrecht province
Rotterdam municipality
- Average WOZ
- €342,000
- Use it to compare
- Lower-WOZ city comparator
WOZ is a tax reference value for a defined geography and date. Asking prices, completed sales and lender reports use different evidence. See the CBS WOZ table for the definitions.
Dated area market snapshots
The guide pages keep live asking-market measures separate from the CBS benchmark. These examples show why the date, geography and sample belong beside the number.
Eindhoven municipal live market
- Checked
- 23 Aug 2026
- Asking-market signal
- 1,490 active listings
- Sample note
- 553 houses, 922 apartments, 521 new-build; live inventory
Eindhoven Centre, Binnenstad
- Checked
- 23 Aug 2026
- Asking-market signal
- €429,095 average asking · €5,607/m² · 36 days
- Sample note
- 59 sold in market snapshot; Centre guide compares internal areas
Strijp-S
- Checked
- 23 Aug 2026
- Asking-market signal
- €5,304/m² · 28 days
- Sample note
- 50 sold; apartment-heavy recently built context
Meerhoven
- Checked
- 23 Aug 2026
- Asking-market signal
- €589,286 average asking · €4,716/m² · 24 days
- Sample note
- 47 sold; planned neighbourhood sample
Aalst
- Checked
- 22 Aug 2026
- Asking-market signal
- €466,857 average asking · €4,847/m² · 29 days
- Sample note
- 58 sold; locality sample within Waalre
Son en Breugel
- Checked
- 21 Aug 2026
- Asking-market signal
- €602,036 average asking · €4,877/m² · 22 days
- Sample note
- 53 sold; municipality sample
Oirschot
- Checked
- 21 Aug 2026
- Asking-market signal
- €4,543/m² · 22 days
- Sample note
- 158 sold; municipality sample
Maarheeze
- Checked
- 22 Aug 2026
- Asking-market signal
- €439,940 average asking · €3,624/m² · 21 days
- Sample note
- 63 sold and 12 for sale; small-village sample
Read these figures as dated context rather than a ranking. Live listings change, and a town, wijk and buurt can have different boundaries. Open the area guide for the internal variation and comparable examples.
What the area data says
Here is the cross-town reading of the standardized fields. The ranking subset uses the same reported measure, while every row keeps its geography, housing level, sample and checked date visible. This lets you see what is high, what is low and which patterns have a sensible housing explanation.
Highest total asking price
Son en Breugel reports €602,036, followed by Waalre at €598,381 and Meerhoven at €589,286. Maarheeze is lowest in this comparable asking-price subset at €439,940.
Highest and lowest asking €/m²
Eindhoven Centre leads at €5,607/m². Maarheeze is lowest at €3,624/m². The Centre result fits a dense, apartment-led sample with smaller floor areas; the village result fits larger homes and plots.
Shortest and longest selling snapshots
Maarheeze reports 21 days, while Son en Breugel and Oirschot report 22 days. Eindhoven Centre reports 36 days. A short snapshot can reflect the homes in the sample as well as demand.
The urbanity extremes
Strijp-S combines 10,419 residents/km², 0% single-family homes and 10% owner occupancy. Maarheeze combines 259 residents/km², 93% single-family homes and 78% owner occupancy. The pair shows why housing mix matters before a price comparison.
WOZ high and low rows
The highest guide-area WOZ row is Aalst at €567,000 and the lowest is Gestel at €318,000. Aalst is a buurt inside Waalre and Gestel is a wijk, so the levels must stay beside the figures.
Nuenen has a wide internal range
The same-date Nuenen snapshots run from €499,762 in Nuenen-Zuid to €700,000 in Nuenen-Oost, a €200,238 difference. Asking €/m² ranges from €3,838 to €4,627, while selling time stays between 22 and 25 days. The Nuenen guide keeps those subareas separate for this reason.
Cross-town rankings
Highest and lowest reported values among rows that contain the same field. Checked dates run from 21 to 23 August 2026.
Average asking price
- Highest observed
- Son en Breugel, €602,036
- Lowest observed
- Maarheeze, €439,940
- What it suggests
- Total price follows the homes in the snapshot, including floor area and plot.
Asking price per m²
- Highest observed
- Eindhoven Centre, €5,607/m²
- Lowest observed
- Maarheeze, €3,624/m²
- What it suggests
- Smaller central apartments can lead on m² price while larger village homes lead on space.
Reported selling time
- Highest observed
- Maarheeze, 21 days
- Lowest observed
- Eindhoven Centre, 36 days
- What it suggests
- Speed belongs with sample size, property type and the checked date.
2025 average WOZ, guide rows
- Highest observed
- Aalst buurt, €567,000
- Lowest observed
- Gestel wijk, €318,000
- What it suggests
- Different CBS levels and local boundaries make this a context comparison.
Owner-occupied share
- Highest observed
- Maarheeze, 78%
- Lowest observed
- Strijp-S, 10%
- What it suggests
- Tenure points to an owner-led village or a rental-heavy apartment area.
Single-family share
- Highest observed
- Maarheeze, 93%
- Lowest observed
- Strijp-S, 0%
- What it suggests
- Housing form helps explain the gap in density and m² price.
Density
- Highest observed
- Strijp-S, 10,419/km²
- Lowest observed
- Maarheeze, 259/km²
- What it suggests
- Urbanity is a setting signal, and it works with housing mix rather than alone.
Observed asking-to-WOZ spread
This comparison subtracts the 2025 WOZ row from the asking-price snapshot where both are documented. It flags a question for the reader. Different dates, boundaries and housing mixes mean it cannot prove that a town or home is overvalued or undervalued.
Eindhoven Centre
- Asking price
- €429,095
- WOZ
- €346,000
- Observed spread
- +€83,095, +24.0%
- How to read it
- Largest positive spread in this subset; Binnenstad asking sample and Centre wijk WOZ have different boundaries.
Gestel
- Asking price
- €388,095
- WOZ
- €318,000
- Observed spread
- +€70,095, +22.0%
- How to read it
- The positive spread needs address-level comparable sales.
Waalre
- Asking price
- €598,381
- WOZ
- €531,000
- Observed spread
- +€67,381, +12.7%
- How to read it
- Municipality rows are closer in scope than the separate Aalst locality row.
Son en Breugel
- Asking price
- €602,036
- WOZ
- €541,000
- Observed spread
- +€61,036, +11.3%
- How to read it
- High asking and WOZ values move together in this snapshot.
Meerhoven
- Asking price
- €589,286
- WOZ
- €533,000
- Observed spread
- +€56,286, +10.6%
- How to read it
- Planned family housing shows a smaller observed spread than central rows.
Maarheeze
- Asking price
- €439,940
- WOZ
- €419,000
- Observed spread
- +€20,940, +5.0%
- How to read it
- Closest pair in this set, with a small village sample.
Aalst
- Asking price
- €466,857
- WOZ
- €567,000
- Observed spread
- -€100,143, -17.7%
- How to read it
- Boundary and sample warning: Aalst is a buurt inside Waalre.
What makes sense: Strijp-S has the density, tenure and apartment pattern expected from a recent urban district. Maarheeze has the lower m² price, larger-house profile and owner-led village pattern expected from a low-density setting. Eindhoven Centre can have the highest m² price alongside a lower WOZ row because smaller apartments and the Binnenstad sample change the mix. What looks strange: Aalst appears to sit below its WOZ on asking price. Its WOZ and asking rows describe different geographies, so start with a boundary check.
What is rising, what is falling, and what can be tested next
The current file gives one dated snapshot for most places. It ranks places against each other on the checked dates, and it cannot show a reliable up or down trend for every place. A direction check needs repeated monthly or quarterly observations with the same boundary, metric and source method.
A useful scenario to monitor is this: apartment-led areas may keep a higher m² price when employment access and demand stay strong, while larger village homes may keep a lower m² price and a high total asking price because floor area and plots are larger. New-build supply, financing costs, energy work, road or airport impacts and a change in sample mix can alter that order. The next dated update should add a change column before a trend claim is made.
Find a similar setting
Central and apartment-led
Eindhoven Centre ↔ Strijp-S. Compare central access, apartment stock, VvE, parking and redevelopment.
Established city districts
Stratum ↔ Gestel ↔ Tongelre. Compare family streets, green edges and city services at neighbourhood level.
Planned Brainport living
Meerhoven ↔ Veldhoven ↔ Best. Compare newer housing, employment access, cycling and services.
Green south
Waalre ↔ Heeze ↔ Sterksel. Compare village services, green edges, rail or road access and sample size.
East-side town services
Nuenen ↔ Geldrop ↔ Mierlo. Compare town centres, family housing, rail/bus access and internal variation.
Kempen village scale
Eersel ↔ Duizel ↔ Steensel ↔ Vessem. Compare centre services, green setting, housing age and evidence limits.
Browse every guide
Every card below points to a canonical guide-style page. Use the district pages for Eindhoven-level context and the named neighbourhood pages when the address falls inside that smaller boundary.
Eindhoven city and districts
Named Eindhoven neighbourhoods
West and south of Eindhoven
East and north of Eindhoven
How to read the numbers
WOZ is a reference
It is assessed for tax purposes and a defined date. Asking prices and mortgage reports use different evidence.
Listings are snapshots
Asking price, asking €/m², selling time and sample size belong together. A live listing can change or leave the market.
Address evidence wins
Type, floor area, plot, condition, energy, title, VvE, parking, permits and lender wording determine the report.
Before you request a valuation
Have the address, property type, purchase agreement or mortgage purpose, lender wording, floor plans, renovation documents, energy information and deadline ready. Dirk-Jan confirms the report type and relevant documents during intake.
The online form is available 24/7. Calls are available 09:00–21:00 every day. The standard report is €599 all-in for the normal service area, including VAT, NWWI validation, cadastral research and normal-area travel. Delivery is within 48 hours after inspection when the file is complete; a 24-hour option is €60 extra when timing and documents allow.
Frequently asked questions
Why can the WOZ value differ from the asking price?
WOZ is an assessed reference value for a defined date and geography. Asking price is a seller’s current market signal. Neither replaces an individual valuation based on the property and lender purpose.
Why do Eindhoven neighbourhoods look so different from one another?
The city contains apartment-led central areas, established family streets, planned districts and green edges. The guides keep neighbourhood boundaries and internal variation visible.
Which places are most useful to compare for Brainport decisions?
Start with Eindhoven, Strijp-S, Meerhoven, Veldhoven, Best and Son en Breugel, then check the exact address and current transport service.
Can I compare a small village with Eindhoven?
Yes. Compare housing type, plot, services, access, green setting, noise, planning and evidence sample. A small sample describes the selected listings; a city-sized average requires a much larger dataset.
What should I send before a mortgage valuation?
Send the address, property type, purpose, lender wording, deadline, purchase agreement if available, floor plans, renovation information and energy documents.
How current are the market figures?
Each area guide states its checked date and sample. Live asking-market figures change quickly; the CBS/WOZ benchmark uses a different reference year.
Regional data and definitions
The benchmark uses the CBS WOZ table, CBS Wijken en Buurten, the North Brabant population and housing monitor, the provincial housing-stock series and the Brainport regional map. Guide listing snapshots are labelled in each guide with source, geography, sample and checked date.