House Valuation in Best
Property valuation Best guide with current asking-price and WOZ context, local housing types, liveability, schools, transport and mortgage checks.
At a glance: Funda’s Best information page showed 199 homes for sale and 4 for rent when checked on 21 August 2026. It recorded an average asking price of €521,024, an average asking price of €4,324 per m², an average selling time of 21 days and 378 homes sold in the previous 12 months. CBS reports 31,652 residents, 13,650 homes, an average 2025 WOZ value of €464,000, 80% single-family homes and 71% owner-occupied homes for the municipality of Best. Those measures describe a moving market and a municipality; they do not set the value of a particular address.
Need a valuation in Best?
Speak directly with Dirk-Jan about your property, mortgage purpose and deadline. Request the report online.

Best in brief
Best is the principal town of the municipality of Best in North Brabant, between Eindhoven and the Brabant Kempen. Its railway station, A2/A58 access, Wilhelminakanaal and nearby Nieuwe Heide make it practical for commuters while the centre, Batadorp, Wilhelminadorp and newer family districts retain a distinct town character. The municipality lists 16 named woonwijken, from Centrum, Hoge Akker and Salderes to Heivelden, Heuveleind, Dijkstraten, Steegsche Velden and Aarlesche Erven.
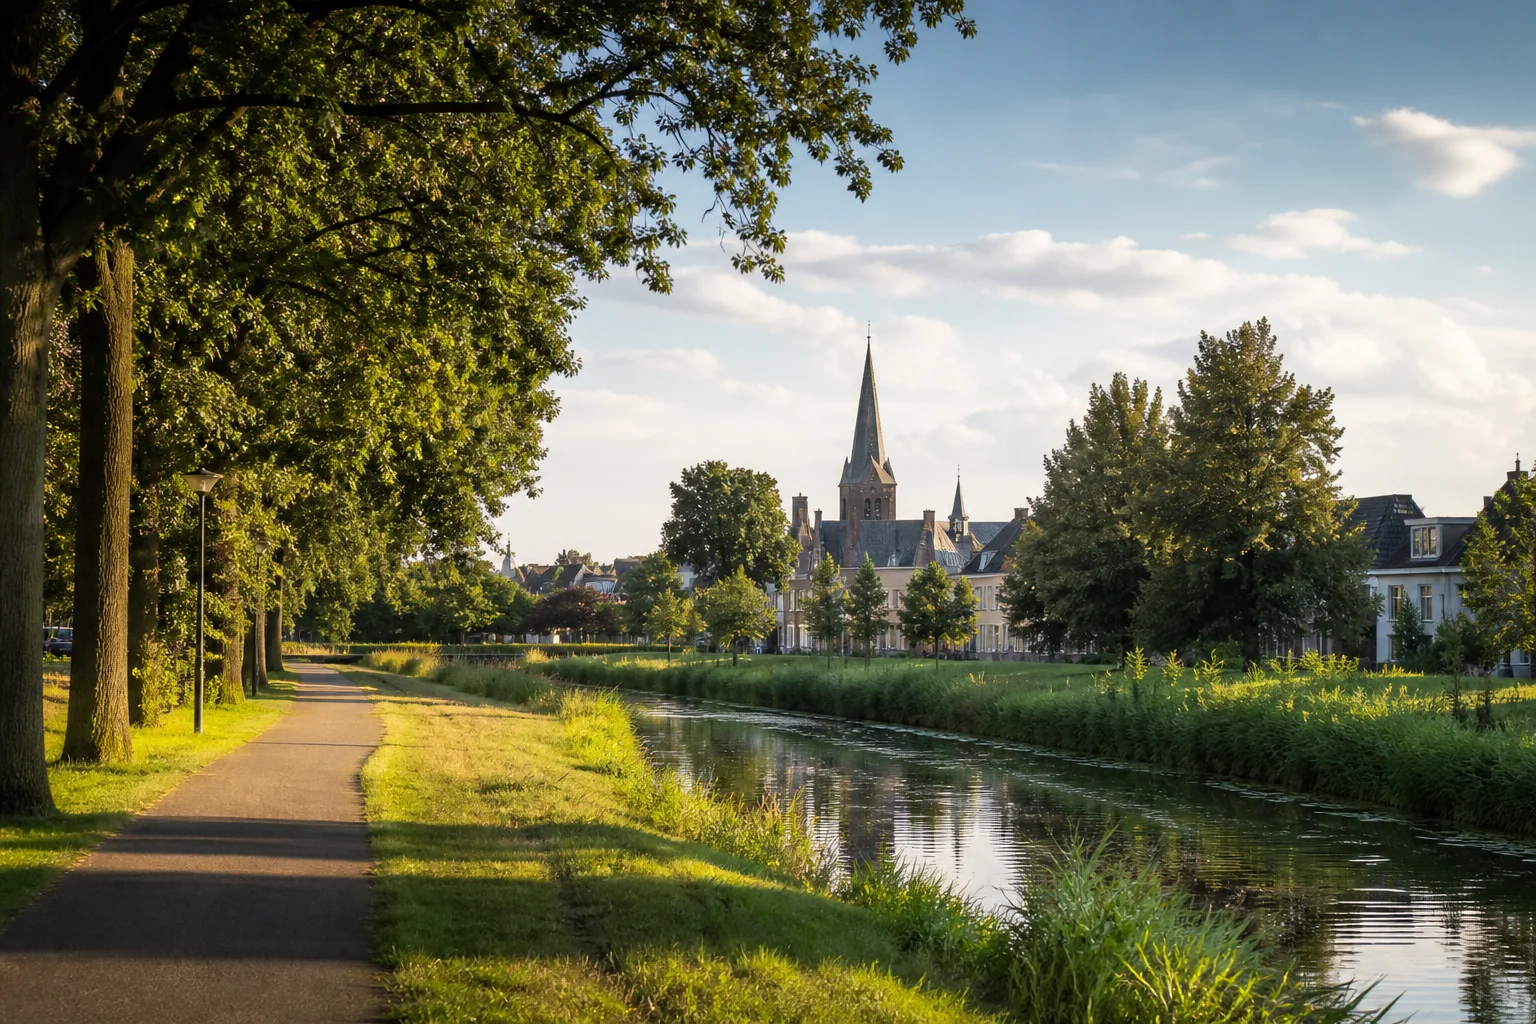
The housing stock is deliberately mixed. Centrum contains apartments and older compact homes; Hoge Akker, Salderes and Naastenbest contain established family streets; Heuveleind and Heivelden have larger owner-occupied family homes; Batadorp has a distinctive historic workers’ village character; Villawijk and Buitengebied contain larger plots; Dijkstraten, Steegsche Velden and Aarlesche Erven add newer housing. A buyer comparing a centre apartment, a post-war terrace, a 1990s detached home and a new-build townhouse is comparing different markets even when the postcode begins with 568x.
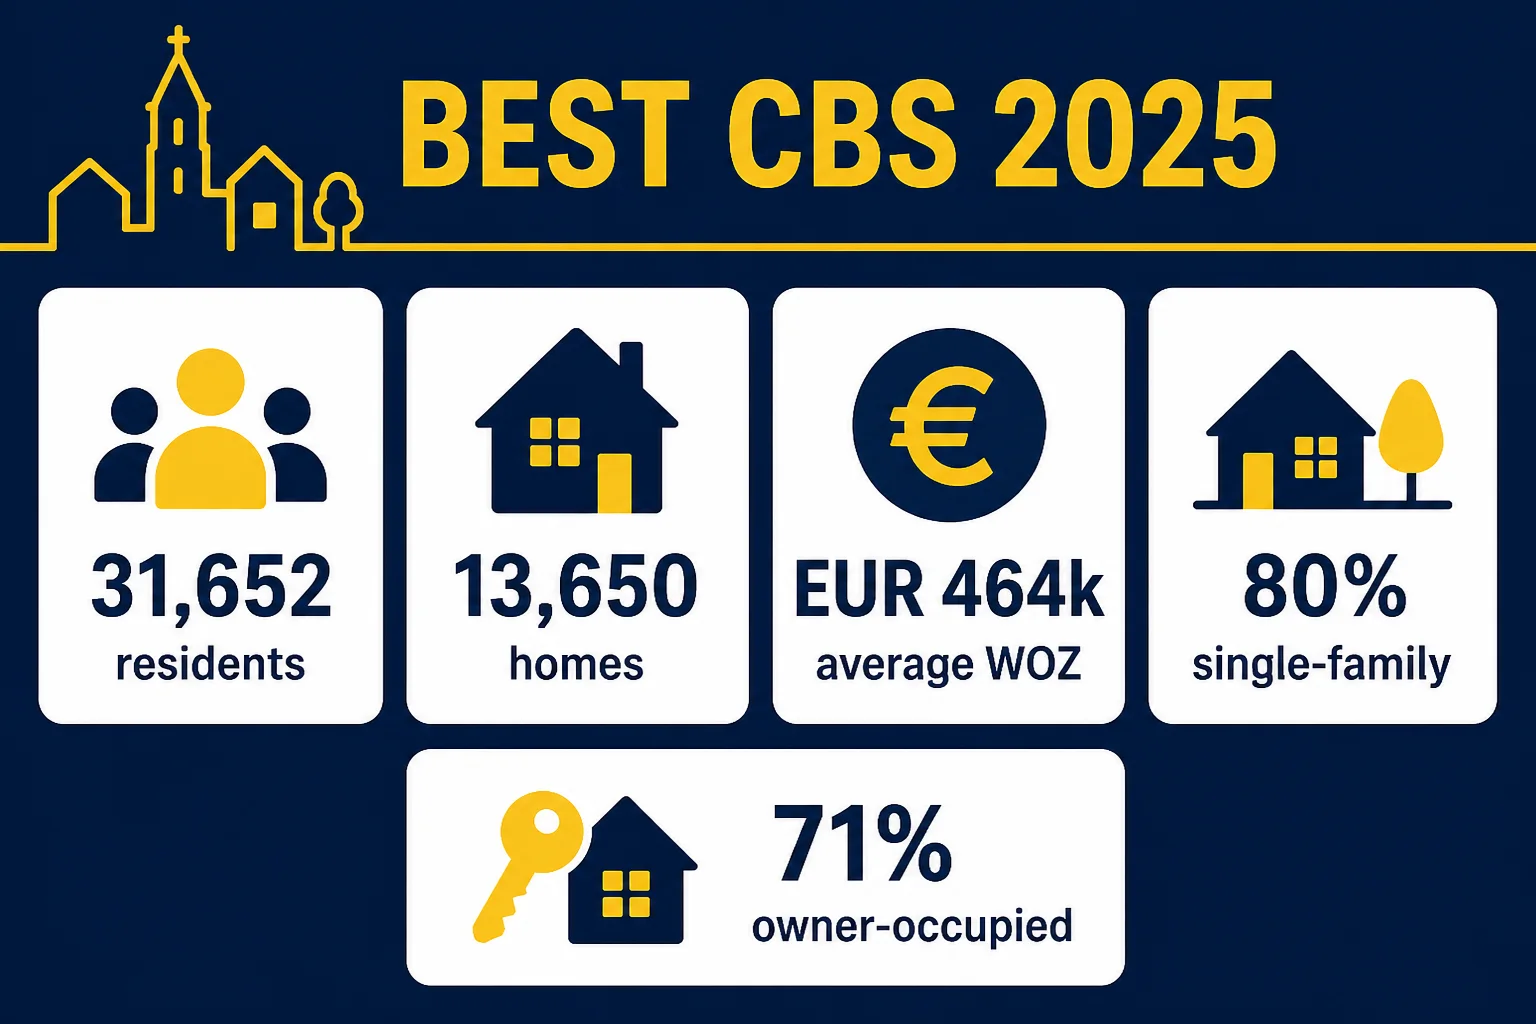
CBS 2025 reports 31,652 residents, 13,948 households and 13,650 homes for the municipality of Best. 80% of homes are single-family and 71% owner-occupied; the average WOZ value is €464,000. The municipality is the correct official comparison geography because Best is divided across named CBS wijk rows rather than one single town-wide row. The neighbourhood table below keeps those rows separate.
Best can suit buyers who want:
- a town with a real railway station, direct regional connections and a short trip to Eindhoven;
- established terraces and apartments as well as semi-detached, detached and new-build family homes;
- green edges such as Nieuwe Heide, De Vleut and Het Groene Woud alongside everyday services;
- nine primary schools and one secondary school in the municipality, plus childcare and clubs;
- a property where plot, renovation, energy performance and the exact neighbourhood all matter.
It can be less suitable for someone who wants a large English-language service network, a city-centre cultural offer outside the region, or a rural address with every service within a short walk. New-build areas can still have active construction, and Buitengebied addresses can require more driving for school, rail and specialist care.
Best at a glance
| Local profile | Best |
|---|---|
| Municipality / province | Best, Noord-Brabant |
| Population | 31,652 residents in municipality Best, 2025 |
| Housing stock | 13,650 homes in municipality Best, 2025 |
| Households | 13,948 in municipality Best, 2025 |
| Typical housing | 80% single-family homes; terraces, corner homes, semi-detached, detached and apartments vary by wijk |
| Tenure | 71% owner-occupied in municipality Best |
| Average WOZ | €464,000 in municipality Best, 2025 |
| Density | 934 residents per km² in municipality Best |
| Green reference points | Nieuwe Heide, De Vleut, Wilhelminakanaal, De Scheeken and the rural Bestse edges |
| Town references | Centrum, Batadorp, Salderes, Heivelden, Dijkstraten, Steegsche Velden and Aarlesche Erven |
Official figures and boundary notes
CBS values are useful context, while a mortgage valuation still has to assess the home itself. The table keeps municipality Best and the Netherlands separate; individual wijk rows are shown later because there is no single CBS Best town row.
| 2025 CBS measure | Municipality Best | Netherlands |
|---|---|---|
| Residents | 31,652 | 18,044,027 |
| Households | 13,948 | 8,430,352 |
| Homes | 13,650 | 8,274,478 |
| Average WOZ value | €464,000 | €398,000 |
| Single-family homes | 80% | 63% |
| Owner-occupied homes | 71% | 57% |
| Population density | 934 residents/km² | 536 residents/km² |
| Land area | 3,389 ha | 3,364,723 ha |
| Water area | 76 ha | 789,614 ha |
| Homes built in latest 10-year measure | 12% | 8% |
| Average distance to GP | 1.0 km | 1.1 km |
| Average distance to a large supermarket | 0.8 km | 1.0 km |
| Average distance to childcare | 0.6 km | 0.7 km |
| Average distance to a school | 0.7 km | 0.8 km |
The distances are municipality-level indicators calculated by CBS. A Centrum address can be much closer to a supermarket and school than a Buitengebied home. Test the actual walking, cycling and driving journey from the property you are considering.
Your next step in Best
Local property market
Best market snapshot
Funda’s Best information page showed 199 homes for sale and 4 for rent when checked on 21 August 2026. It recorded an average asking price of €521,024, an average asking price of €4,324 per m², an average selling time of 21 days and 378 homes sold in the previous 12 months. The snapshot combines town-centre apartments, family streets, detached homes and larger rural plots.
| Selected Funda example | Listing status | Last asking price | Living area / plot | Energy label |
|---|---|---|---|---|
| Mr. C. Goselingstraat 34 | Current listing snapshot | €409,000 | 102 m² / 165 m² | D |
| Mandenmaker 1 | Current listing snapshot | €539,500 | 134 m² / 337 m² | C |
| Rogvelden 12 | Current listing snapshot | €699,000 | 178 m² / 254 m² | A |
| Klimopstraat 23 | Current listing snapshot | €490,000 | 118 m² / 134 m² | C |
| Dorsvelden 12 | Current listing snapshot | €1,275,000 | 291 m² / 607 m² | B |
Funda amounts are last asking prices, not final transaction evidence. The spread from a compact apartment to a large detached or rural property shows why one town average cannot describe a normal Best home.
Neighbourhood supply signals
Funda’s place page and neighbourhood pages cover different search scopes, while CBS divides Best into named statistical rows. The figures below are snapshots shown on the relevant Funda pages and checked in August 2026; active counts and averages change as homes are listed, reserved or removed.
| Area shown on Funda | Homes for sale / rent | Average asking price | Average €/m² | Average selling time | Homes sold in previous 12 months |
|---|---|---|---|---|---|
| Best overall | 199 / 4 | €521,024 | €4,324 | 21 days | 378 |
| Centrum | 12 / 1 | €528,381 | €5,027 | 26 days | 28 |
| Heivelden | 13 / 0 | €645,286 | €4,491 | 23 days | 60 |
| Dijkstraten | 5 / 1 | €641,571 | €4,751 | 19 days | 27 |
| Speelheide | 3 / 0 | €518,571 | €3,895 | 19 days | 19 |
| Aarlesche Erven | 61 / 0 | Not shown in the snapshot | Not shown | Not shown | Not shown |
| Buitengebied | 5 / 0 | Not shown in the snapshot | Not shown | Not shown | Not shown |
The neighbourhood figures are useful orientation, while their sample sizes and housing mixes differ. Aarlesche Erven is a newer growth area with a large active supply, while Buitengebied has fewer listings and a more dispersed housing mix; neither should be pooled with the overall Best figure.
What local listings show about housing types
These Funda examples frame the questions to ask during a valuation. They are current or recent listing examples, and a last asking price is not a final transaction price.
| Example | Last asking price | Living area / plot | Build period / label | What it helps a buyer ask |
|---|---|---|---|---|
| De Korte Spruit 1, current snapshot | €539,000 | 132 m² / 206 m² | 1977 / B | How should an extended corner home with four bedrooms, 12 solar panels and upgraded glazing be compared? |
| Het Veld 21, sold listing | €475,000 last asking | 115 m² / 179 m² | 1982 / A | Which features supported the last asking price for this family home with 11 solar panels? |
| Kloosterstraat 1, current snapshot | €899,000 | 181 m² / 665 m² | 1965 / C | How do a historic-centre semi-bungalow, outbuilding, garage and two plots affect comparability? |
| Stenenstraatje 10, current snapshot | €785,000 | 178 m² / apartment | 2009 / A | How should a large centre apartment with roof terrace, two parking spaces and a VvE fee be compared? |
| Kapittelhof 27, current snapshot | €485,000 | 117 m² / apartment | c.1996 / B | How do a maisonette plan, 28 m² roof terrace and service costs affect the buyer pool? |
The examples span Wilhelminadorp, De Leeuwerik and Heivelden, with family homes ranging from a renovated terrace to a detached-style property. A report uses comparable completed sales and the inspection, while these listings help identify the questions that need evidence.
Why one Best number can mislead
Centrum, Villawijk, Buitengebied, Heivelden and Aarlesche Erven contain different housing ages, plot sizes and access patterns. A €464,000 municipal average WOZ for Best does not explain a €377,000 average in Centrum, a €1.041 million average in Villawijk, a €725,000 average in Buitengebied or a €611,000 average in Aarlesche Erven. Those figures are assessment averages across different housing mixes, not a direct market ranking.
The most useful comparables match:
- living area, plot and housing form;
- construction period, renovation level and energy label;
- garden, parking, garage, roof terrace, outbuildings and privacy;
- legal title, easements, permits, VvE obligations and heritage restrictions;
- exact centre, family-street, village-edge or rural setting;
- lender purpose, valuation date and report requirements.
What drives value in Best
Town setting and micro-location
Best’s centre contains older brick homes, apartments and streets around the market and church. Batadorp and Wilhelminadorp have distinctive historic housing, while Hoge Akker, Salderes, Naastenbest, Heuveleind and Heivelden bring established family streets. Dijkstraten, Steegsche Velden and Aarlesche Erven add newer housing, while Villawijk and Buitengebied bring larger plots and more dispersed settings. A short walk to shops and school can matter greatly to one buyer, while another may value privacy, parking and garden space.

The Wilhelminakanaal, the A2/A58, the railway and local approach roads can affect noise, access, views and future construction activity. Planned growth in Aarlesche Erven and Dijkstraten can also change outlook and traffic. A green-looking address can still have a busy school journey or a planning change nearby. These factors belong in the inspection and legal review rather than a town-wide average.
Housing form, plot and condition
CBS records 80% single-family housing for municipality Best. That broad figure includes terraced and corner homes, semi-detached and detached homes in family streets, apartments in the centre, older properties with heritage constraints and larger homes in Buitengebied. Plot size, usable living area, condition and legal permissions create large differences inside one postcode.
| Value factor | Best question | Evidence to collect |
|---|---|---|
| Exact setting | Is the home in Centrum, Batadorp, Wilhelminadorp, Heivelden, a new-build district or Buitengebied? | Address, postcode, map context and comparable sales |
| Living area | Does the stated floor area follow NEN 2580 measurement rules? | Floor plans, measurement report and permit history |
| Plot and boundaries | Do cadastral boundaries, garden use, ditch or canal edge match the description? | Cadastral extract, deed, survey and purchase documents |
| Condition | What is the condition of roof, facade, windows, installations and foundations? | Inspection findings, invoices, maintenance records and photographs |
| Energy | Does the official label match insulation, glazing, heating and solar systems? | Current energy label, installation specifications and invoices |
| Heritage | Is the property listed or inside a protected village view? | Monument register, municipal guidance and consent history |
| Extensions | Are dormers, extensions, garages, offices and conversions permitted and included? | Permits, drawings, completion information and title documents |
| Apartment / VvE | Are reserve funds, service charges and planned works documented? | MJOP, minutes, insurance and VvE accounts |
| Local market fit | Which buyer group would compare this home with which other homes? | Recent completed sales matched by type and setting |
Planning and new housing
The municipality’s housing programme focuses on future-ready housing, appropriate new construction, housing with care and wellbeing, and liveability. The municipal Aarlesche Erven project describes a green neighbourhood with 880 new homes in various types. The municipality also reports planning for Aarlesche Erven Fase IV and a new gym serving Dijkstraten and Aarlesche Erven; construction and use dates remain subject to approvals and delivery decisions.
New housing can add choice for starters and families while changing traffic, views, construction activity and the mix of homes. A planning intention is not a completed development. Check the current omgevingsplan, legal status, access, phasing, tenure, final drawings and delivery information for the exact property before relying on a future premium or discount.
Energy and future running costs
Current Best listings span labels from F to A, with renovated family homes, apartments from the 1990s and 2000s, and older centre properties requiring closer inspection. An energy label gives one reference point. It does not show actual energy use, ventilation, installation age or planned replacement cost. Ask for the label, insulation details, heating source, solar ownership, service records and improvement plans.
Living in Best
Everyday life
Best combines a historic centre, family neighbourhoods and green edges. The market area, Batadorp and Wilhelminadorp heritage streets, schools, sport and local associations provide everyday anchors. Nieuwe Heide, De Vleut and De Scheeken add accessible nature, while Eindhoven, Tilburg and ‘s-Hertogenbosch add larger employment, healthcare, culture and shopping options. Buitengebied addresses can feel quieter, while the centre brings more activity, older housing and parking questions.
The trade-off is practical. Many households plan larger shopping, rail travel, specialist healthcare and international administration outside the town. A centre apartment may reduce driving for errands but bring heritage, VvE or parking constraints. A detached or rural-edge home can offer more space with more maintenance and car use.
Expat suitability
Expat fit: medium. An international household can use Best as a historic, green base near Eindhoven, Brainport workplaces and regional towns. Schools, municipal information and many everyday services are mainly Dutch. English-language explanations are easier to arrange through a lender and adviser who regularly serve international buyers.
| Expat question | Local answer | Practical check |
|---|---|---|
| Employment | Eindhoven, Brainport, Best, Tilburg and ‘s-Hertogenbosch are the main work references | Test the full journey from the actual address at the relevant working time |
| English support | Municipal, school and many local-service pages are mainly in Dutch | Ask the lender, school and municipality which documents can be explained in English |
| Schooling | Best has 9 primary schools and 1 secondary school, Heerbeeck College | Confirm admission, language support and the next school stage directly |
| Rental bridge | Rental choice is smaller than in Eindhoven or Tilburg | Plan temporary housing and purchase timing early |
| Daily shopping | Centre and local neighbourhood shops are supplemented by larger towns | Check opening hours, delivery, parking and the household’s weekly pattern |
| Healthcare | CBS places the average GP distance at 1.0 km in municipality Best | Check registration, provider availability and out-of-hours care |
Families and children
School and childcare
The municipality lists 9 primary schools and 1 secondary school, Heerbeeck College. Childcare providers are checked through the national register. Admission, language support, childcare places, holiday cover and the next-school journey must be confirmed directly.
CBS gives an average distance of 0.7 km to a school and 0.6 km to childcare for municipality Best. Parents should test walking and cycling conditions, crossings, before- and after-school arrangements and the journey from the actual address.
Sport, play and community
Best’s sports and culture pages list local clubs and activities, while the historic centre, Nieuwe Heide, De Vleut and De Scheeken support walking and cycling. Check current membership, training times, waiting lists, coaching and safe evening travel before relying on any activity.
| Family factor | Best | Buyer check |
|---|---|---|
| Primary schools | Multiple named primary schools across the municipality | Admission, language support and school-day logistics |
| Secondary school | Heerbeeck College in Best | Course choice, travel and later school stages |
| Childcare | CBS average 0.6 km in municipality Best; current providers must be checked | Places, hours and holiday cover |
| Sports and community | Local clubs, culture and play facilities | Training times, membership and evening travel |
| Nature | Nieuwe Heide, De Vleut, De Scheeken, Wilhelminakanaal and Het Groene Woud | Lighting, cycling access, water and exact-address conditions |
| Larger services | Eindhoven, Best, Tilburg and ‘s-Hertogenbosch | Weekly travel, parking and backup plans for children |
Safety and liveability
Safety services and personal checks
The municipality’s safety page links to Best Veilig, police contacts, neighbourhood officers and AED information. These are practical local services, while a page or police incident display does not produce a single address-level safety score. At a viewing, check lighting, sightlines, door security, parking, bicycle storage and the approach to the home after local facilities close.
Conditions vary between the centre, family neighbourhoods, new-build areas and dispersed rural rows. Use the current municipal and police information for the exact address and time of day.
Environmental checks
Atlas Leefomgeving can be used to check noise, air, heat, water, soil and flood information for the exact address. Best’s green setting does not make every plot the same. A canal-side garden, A58 approach, agricultural edge, former business use or older centre building can change the practical experience and the valuation questions.
| Check | Why it matters |
|---|---|
| Noise and traffic | Centre streets, school approaches, the A58 and local roads attract different buyers |
| Water and drainage | The Wilhelminakanaal, ditches and low-lying land can affect gardens, foundations and insurance questions |
| Soil and former use | Older centre, business and farm uses call for a soil and permit check |
| Heat and shade | Trees, paving, orientation and insulation affect comfort |
| Air and agricultural activity | Exact distance and wind conditions matter more than a town-wide label |
| Heritage | Listed buildings and protected village views can affect alterations and maintenance |
| Nearby planning | Aarlesche Erven, Dijkstraten and other municipal plans can affect outlook, access and construction activity |
Getting around
Bus, cycling and rail
Best has an NS railway station with regional connections. Local buses and cycling links add first- and last-leg options toward Eindhoven and nearby towns. Use the NS, 9292 or current operator planner for the actual address, date and destination because departure times, school-day patterns and holiday services can change.
The municipality’s transport information covers cycling and traffic conditions, while A2/A58 access supports car travel. A planned or named connection is not the same as a completed path, so check current works and the safest journey from the address.
| Destination or service | Local indicator | What to check |
|---|---|---|
| Primary school | About 0.7 km average in municipality Best | Street crossing, cycling safety and admission |
| Childcare | About 0.6 km average in municipality Best | Place, hours and holiday cover |
| GP | About 1.0 km average in municipality Best | Registration, appointment access and out-of-hours care |
| Large supermarket | About 0.8 km average in municipality Best | Weekly shopping, parking and delivery options |
| Rail connection | Best NS station | First and last leg, bicycle parking and live timetable |
| Eindhoven and Brainport | Regional employment and services | Actual office address, peak traffic, parking and public transport changes |
The distance figures are planning aids, not guarantees. Use the exact property address and a current planner before deciding whether a car, bicycle or bus connection meets the household’s needs.
Amenities and leisure
Best has a historic centre, Batadorp and Wilhelminadorp heritage streets, local museums, shops and community facilities. Nieuwe Heide covers nearly 300 hectares, while De Vleut, De Scheeken, the Wilhelminakanaal and Het Groene Woud support walking and cycling. Local sports and culture organisations provide clubs and events.
Check opening times, current membership and event dates directly. A centre location can offer more daily activity, while a rural-edge property may trade a quieter setting for a longer trip to shops and evening services.
Costs beyond the purchase price
| Cost or commitment | Best context | Check before purchase |
|---|---|---|
| Mortgage valuation | Cheetah Valuations charges €599 including VAT, NWWI validation, cadastral research and normal-area travel; a 24-hour report option costs €60 extra when agreed requirements are complete | Confirm report type, lender wording, documents and deadline before the inspection |
| Buyer costs | Transfer tax, notary, mortgage advice, inspection, broker and moving costs depend on the deal | Ask each provider for a current written quote |
| Municipal charges | Property and household charges depend on the address and resident situation | Check the latest assessment and municipal tariffs |
| Energy | Older centre homes, family houses and larger detached properties can need insulation, heating or roof work | Review label, installations, invoices and planned replacement |
| Maintenance | Gardens, roofs, drainage, outbuildings and older facades need regular care | Budget for near-term work and ask for records |
| Insurance | Building, contents, liability and outbuilding cover depend on the home | Check exclusions for water, business use, monuments and detached structures |
| Travel | A town or rural-edge setting can add fuel, parking, bicycle and public-transport costs | Add the weekly work, school and shopping pattern to the budget |
The valuation fee is one part of a mortgage budget. A lender may use the report for its lending decision, while the lender still decides whether to lend and on what terms. Municipal, energy, insurance and maintenance figures need an address-specific check.
Neighbourhoods within Best
CBS provides 19 named neighbourhood rows in municipality Best. The table keeps each official row separate from the practical settings buyers see in listings; values are 2025 CBS context, not a market-price ranking.
| CBS area | 2025 profile | Housing signal | What a valuation should check |
|---|---|---|---|
| Centrum | 1,590 residents, 1,092 homes, average WOZ €377,000 | 13% single-family, 41% owner-occupied | Apartments, older fabric, parking, VvE and street activity |
| Hoge Akker | 1,765 residents, 879 homes, average WOZ €356,000 | 74% single-family, 68% owner-occupied | Established family streets, extensions and condition |
| Speelheide | 1,345 residents, 524 homes, average WOZ €509,000 | 98% single-family, 98% owner-occupied | Predominantly family homes, gardens and energy upgrades |
| De Leeuwerik | 1,645 residents, 778 homes, average WOZ €406,000 | 72% single-family, 63% owner-occupied | Mixed family housing, extensions and comparable selection |
| Villawijk | 250 residents, 115 homes, average WOZ €1,041,000 | 79% single-family, 74% owner-occupied | Larger homes, plots, privacy and comparable scarcity |
| Batadorp | 485 residents, 214 homes, average WOZ €461,000 | 100% single-family, 97% owner-occupied | Historic workers’ village, heritage, extensions and access |
| Salderes | 3,400 residents, 1,439 homes, average WOZ €468,000 | 97% single-family, 81% owner-occupied | Established family stock, plot and renovation differences |
| Wilhelminadorp | 3,600 residents, 1,692 homes, average WOZ €365,000 | 77% single-family, 64% owner-occupied | Older family streets, accessibility and varied condition |
| Naastenbest | 4,215 residents, 1,723 homes, average WOZ €399,000 | 82% single-family, 55% owner-occupied | Mixed tenure, family layouts and local access |
| ‘t Zand | 135 residents, 42 homes, average WOZ €343,000 | 67% single-family, 48% owner-occupied | Small sample, housing mix and limited comparables |
| Breeven | 75 residents, 12 homes, WOZ not reported | Housing and tenure mix not reported | Very small sample; verify the exact setting and comparables |
| Heide | No populated housing metrics in 2025 row | No populated housing metrics | Treat as an area boundary, not a market average |
| Heuveleind | 3,315 residents, 1,287 homes, average WOZ €524,000 | 93% single-family, 85% owner-occupied | Larger family homes, energy and plot differences |
| Heivelden | 3,795 residents, 1,491 homes, average WOZ €566,000 | 78% single-family, 87% owner-occupied | Family housing, gardens, newer phases and energy |
| Buitengebied | 1,230 residents, 435 homes, average WOZ €725,000 | 96% single-family, 87% owner-occupied | Detached homes, large plots, access, soil and water |
| Dijkstraten | 1,865 residents, 756 homes, average WOZ €473,000 | 90% single-family, 60% owner-occupied | Newer phases, construction, plot and energy context |
| Kantonnier | 1,330 residents, 558 homes, average WOZ €424,000 | 100% single-family, 78% owner-occupied | Family homes, access and comparable supply |
| Steegsche Velden | 600 residents, 207 homes, average WOZ €555,000 | 100% single-family, 81% owner-occupied | New-build stock, warranties, energy and unfinished surroundings |
| Aarlesche Erven | 1,005 residents, 406 homes, average WOZ €611,000 | 99% single-family, 85% owner-occupied | Active development, new-build specifications and construction phases |
The CBS rows are statistical boundaries and WOZ assessments, not a ranking of market prices. A lender-ready report uses the individual address, inspection, legal documents and completed comparable evidence.
Is Best a good place to buy?
Best can be a good fit for a buyer who wants a historic centre, family neighbourhoods, green edges and access to Brainport employment. The current listing sample includes centre apartments, family homes in Wilhelminadorp and Heivelden, new-build supply and larger homes with land or outbuildings. Schools, sport, nature and municipal services add practical value for households who plan their weekly travel around the town.
The trade-offs are practical. Best’s railway station is convenient for many households, while Buitengebied addresses can still require more driving for specialist healthcare and larger shopping. Historic or listed homes can carry consent and maintenance questions; new-build areas can have active construction. Compare the exact home, street and weekly journey rather than relying on the town name alone.
Before you rely on a valuation
- Match comparable homes by living area, plot, housing type, build period, condition, energy label and Best setting.
- Keep Funda asking prices, completed-sale evidence and CBS WOZ figures in separate columns.
- Check title, cadastral boundary, rights of way, shared access, land use, permits, VvE obligations and heritage status.
- Verify NEN 2580 floor area, energy-label validity, extensions, dormers, outbuildings and renovation records.
- Use Atlas Leefomgeving exact-address tools for noise, water, soil, heat and air questions.
- Ask the lender or mortgage adviser whether the report needs NWWI validation, NHG wording, a renovation value or another purpose.
- Preserve the stated deadline and document list so the inspection and report can be planned correctly.
- Treat a town guide and WOZ figure as context. A lender-ready report assesses the individual home on the agreed valuation date.
How to read the local figures
Active listings: the number of homes shown by Funda at the time of the search. It changes as homes are listed, reserved or removed.
Last asking price: the published seller asking amount on a Funda listing. It can differ from the final transaction amount.
Asking price per m²: a listing indicator for comparing similar homes. It does not replace a completed-sale analysis.
WOZ value: a municipal assessment measure in the CBS table. It provides local context and does not equal current market value or the amount a lender will accept.
CBS neighbourhood: a statistical boundary. The Best rows have different sizes and housing mixes, so they should not be combined without saying which geography is used.
Compare Best with nearby towns
Property valuation guide for Son en Breugel
The Son en Breugel snapshot recorded an average asking price of €602,036 at €4,877 per m².
The Best snapshot recorded an average asking price of €521,024 at €4,324 per m².
Son en Breugel showed an average selling time of 22 days from 53 homes sold in the previous 12 months. Best showed an average selling time of 21 days from 378 homes sold in the previous 12 months.
In the 2025 CBS context, Son en Breugel records an average WOZ value of €517,000, 87% single-family homes, 75% owner-occupied homes. In the 2025 CBS context, Best records an average WOZ value of €464,000, 80% single-family homes, 71% owner-occupied homes.
Son en Breugel is higher on both the asking total and asking price per m² than Best. The Son en Breugel sample moved about 1 day slower. Match the exact address, property type, plot, condition, energy performance and report purpose before using either headline as a comparable.
Property valuation guide for Oirschot
The Oirschot snapshot recorded an average asking price of €504,738 at €4,543 per m².
The Best snapshot recorded an average asking price of €521,024 at €4,324 per m².
Oirschot showed an average selling time of 22 days from 158 homes sold in the previous 12 months. Best showed an average selling time of 21 days from 378 homes sold in the previous 12 months.
In the 2025 CBS context, Oirschot records an average WOZ value of €503,000, 76% single-family homes, 71% owner-occupied homes. In the 2025 CBS context, Best records an average WOZ value of €464,000, 80% single-family homes, 71% owner-occupied homes.
Oirschot has the lower asking total, while its asking price per m² is higher than Best; smaller homes or a different stock mix can account for that pattern. The Oirschot sample moved about 1 day slower. Match the exact address, property type, plot, condition, energy performance and report purpose before using either headline as a comparable.
Property valuation guide for Veldhoven
The Veldhoven snapshot recorded an average asking price of €484,143 at €4,663 per m².
The Best snapshot recorded an average asking price of €521,024 at €4,324 per m².
Veldhoven showed an average selling time of 33 days from 82 homes sold in the previous 12 months. Best showed an average selling time of 21 days from 378 homes sold in the previous 12 months.
In the 2025 CBS context, Veldhoven records an average WOZ value of €518,000, 84% single-family homes, 78% owner-occupied homes. In the 2025 CBS context, Best records an average WOZ value of €464,000, 80% single-family homes, 71% owner-occupied homes.
Veldhoven has the lower asking total, while its asking price per m² is higher than Best; smaller homes or a different stock mix can account for that pattern. The Veldhoven sample moved about 12 days slower. Match the exact address, property type, plot, condition, energy performance and report purpose before using either headline as a comparable.
Relevant guides and next step
- Request a mortgage valuation in Eindhoven when you have the Best address, purpose, lender wording and deadline.
- Property valuation services in Eindhoven for residential scope, inclusions, pricing and report timing.
- About Cheetah Valuations and Dirk-Jan for the appraiser’s professional background and English-language intake.
- Documents needed for a mortgage valuation in the Netherlands before the inspection.
- Property valuation in Heeze and property valuation in Riethoven for comparisons with other small-town guides.
Written by Dirk-Jan Bonenkamp, NRVT-registered residential appraiser at Cheetah Valuations.
To compare this area with nearby towns and neighbourhoods, visit the Eindhoven property valuation comparison hub.
FAQ
What is the average house price in Best?
Funda’s Best information page showed 199 homes for sale and 4 for rent on 21 August 2026, with an average asking price of €521,024. The active mix and search count change, so one average cannot describe every address. CBS reports an average 2025 WOZ value of €464,000 for municipality Best.
What is the average asking price per square metre in Best?
Funda’s August 2026 information snapshot recorded an average asking price of €4,324 per m². It is a moving asking-price sample that includes different home types and plots. Compare homes with similar area, housing form, condition, energy performance and setting before drawing a conclusion.
How many homes are for sale in Best?
Funda’s information page showed 199 homes for sale and 4 for rent. Active supply changes as homes are listed, reserved or removed, and a listing can appear in more than one search view.
How does the WOZ value compare with the market price?
The WOZ figure is a municipal tax assessment. It provides broad local context and does not replace a current market valuation. A report for a mortgage uses the property’s condition, legal information, purpose, valuation date and completed comparable evidence.
Which parts of Best have different housing conditions?
CBS rows show distinct profiles. Centrum has 1,092 homes and an average WOZ of €377,000, while Villawijk has 115 homes and an average WOZ of €1.041 million; Heivelden has 1,491 homes with an average WOZ of €566,000, and Aarlesche Erven has 406 homes with an average WOZ of €611,000. The rows should not be blended with the municipal Best figure without naming the geography.
Is Best suitable for families?
It can suit a family that values nine primary schools, Heerbeeck College, community facilities, sport, play areas and green space. Confirm admission, childcare places, opening hours and safe cycling conditions before buying.
Is Best suitable for expats?
Best can suit an international household working in Eindhoven or another regional employment centre that wants a historic town and is comfortable with local travel. Schools, healthcare and community information are mainly Dutch, so ask the lender, school and municipality which documents can be explained in English. Test the full work journey and plan temporary housing early.
Is Best safe?
The municipality provides Best Veilig, police contacts and neighbourhood-officer information. These services help with local checks, while an incident display or personal impression is not an address-wide rating. Check lighting, access, parking, door security, bicycle storage and the evening journey at the exact address.
How do people travel from Best?
Best has an NS railway station, with local bus and cycling connections for the first and last leg. The current NS, 9292 or operator planner should be checked for the address, date and destination. Include the first and last leg, holiday service and transfer time in the decision.
Are new homes planned in Best?
The municipality’s Aarlesche Erven project describes a green neighbourhood with 880 new homes in various types. Planning for Aarlesche Erven Fase IV and a new gym serving Dijkstraten and Aarlesche Erven is subject to approvals, phasing and delivery decisions. Check the latest municipal information before relying on a nearby development effect.
What affects the value of an Best home?
Living area, plot, housing type, condition, energy label, extensions, outbuildings, legal title, heritage status, access, noise, water, nearby planning and comparable completed sales all matter. A centre apartment, Heivelden family home and Buitengebied property need different comparison sets. The report purpose and lender requirements also shape the checks.
How much does a mortgage valuation cost in Best?
Cheetah Valuations’ standard residential valuation fee is €599 including VAT, NWWI validation, cadastral research and normal-area travel. A 24-hour report option costs €60 extra when the requirements and documents are complete and the timing is agreed. Confirm the report type and lender wording before the inspection.
What should I send before requesting the report?
Send the Best address, housing type, purchase or mortgage purpose, lender or adviser wording, deadline and any relevant purchase agreement, plans, permits, energy documents and renovation information. Dirk-Jan can then confirm the report format, inspection timing and document needs.