House Valuation in Helmond
Property valuation Helmond guide with current asking-price and WOZ context, local housing types, liveability, schools, transport and mortgage checks.
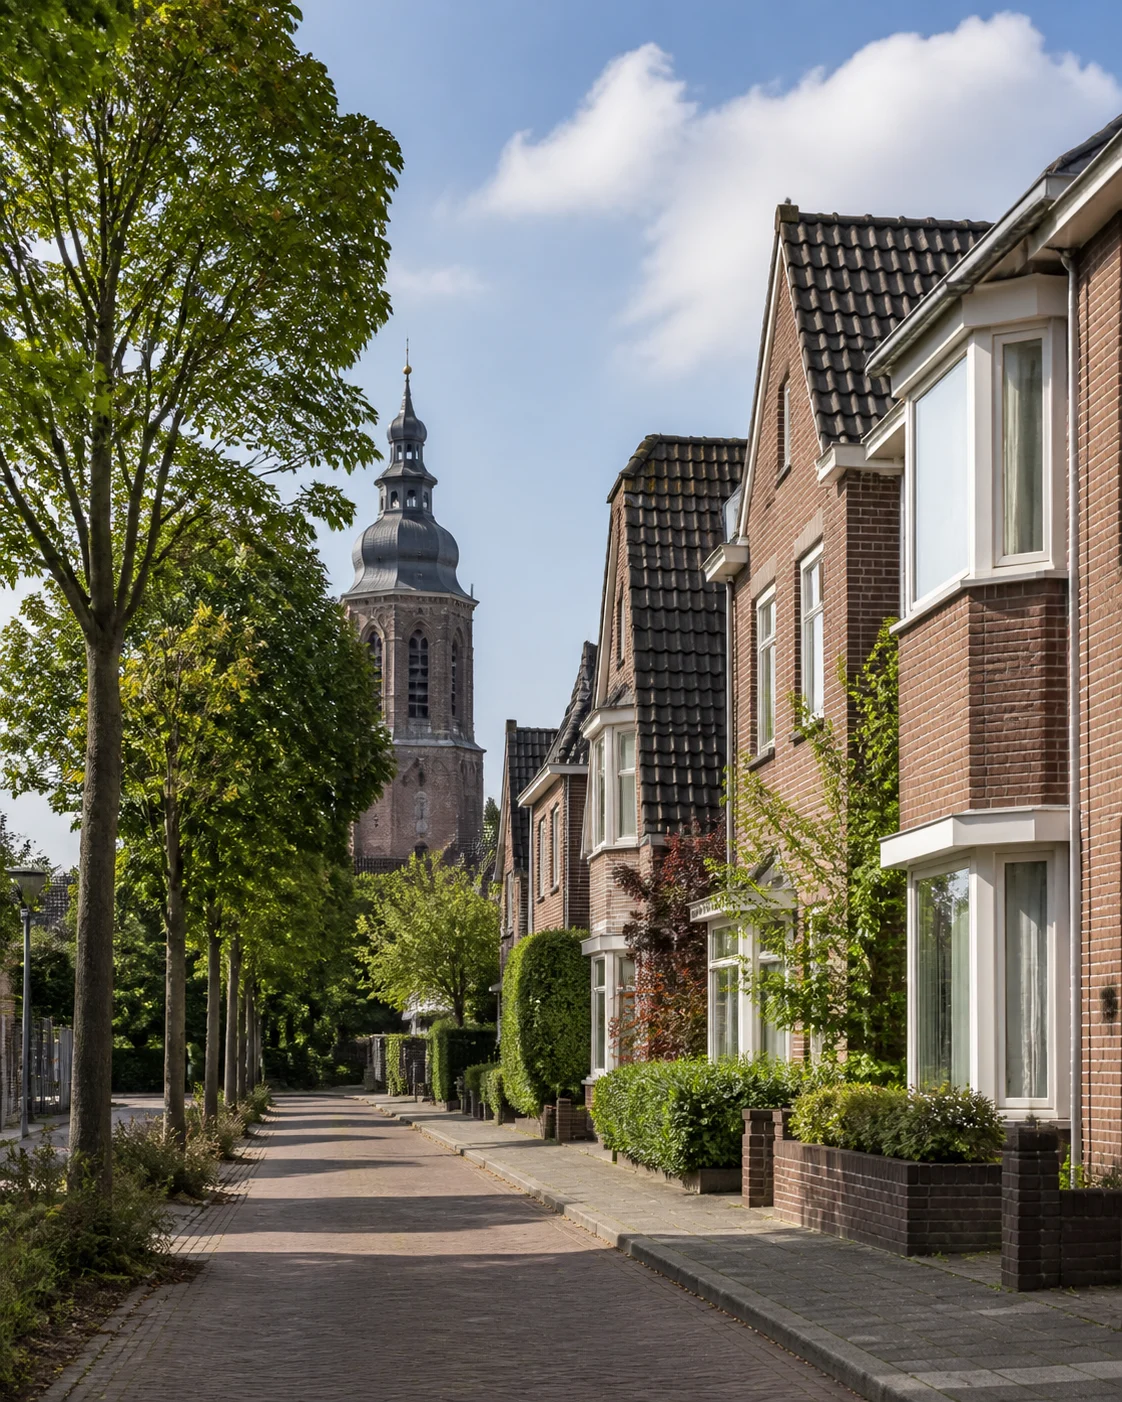
Helmond is a city in Noord-Brabant east of Eindhoven, with a historic centre, established family districts, newer neighbourhoods and green edges. Binnenstad, Helmond-Oost, Helmond-Noord, ’t Hout, Brouwhuis, Helmond-West, Warande, Stiphout, Rijpelberg, Dierdonk, Brandevoort and the southern industrial area each create a different housing and location context. If you are buying a house in Helmond, selling one or arranging a mortgage valuation, a city-wide average is only a starting point.
At a glance: A Funda Helmond information snapshot checked on 22 August 2026 showed 437 homes for sale, an average asking price of €414,571, an average asking price of €3,760 per m², and an average selling time of 22 days, based on 1,016 homes sold in the previous 12 months. The CBS 2025 neighbourhood dataset records 43,549 homes and an average WOZ value of €345,000 for Helmond municipality. Asking prices, WOZ values and a mortgage valuation answer different questions and should not be treated as interchangeable.
This is a local market guide, not an individual property valuation or a mortgage offer. A lender normally requires a report prepared to the stated lender and validation requirements by an appropriately qualified independent valuer. Exact value depends on the address, condition, legal title, energy performance, property type, purpose, valuation date and comparable completed sales. Request an official mortgage valuation in Helmond when you know the lender requirements.
Need a valuation in Helmond?
Speak directly with Dirk-Jan about your property, mortgage purpose and deadline. Request the report online.

Helmond in brief
Helmond combines a compact centre with residential districts that were built in different periods. The city is connected to Eindhoven and the wider Brainport region, while its own employment, schools, sport facilities, canals and green corridors give it a distinct daily rhythm. Brandevoort and Dierdonk have a very different housing profile from Binnenstad or Helmond-West; the exact district is therefore material when choosing comparable homes for a valuation.
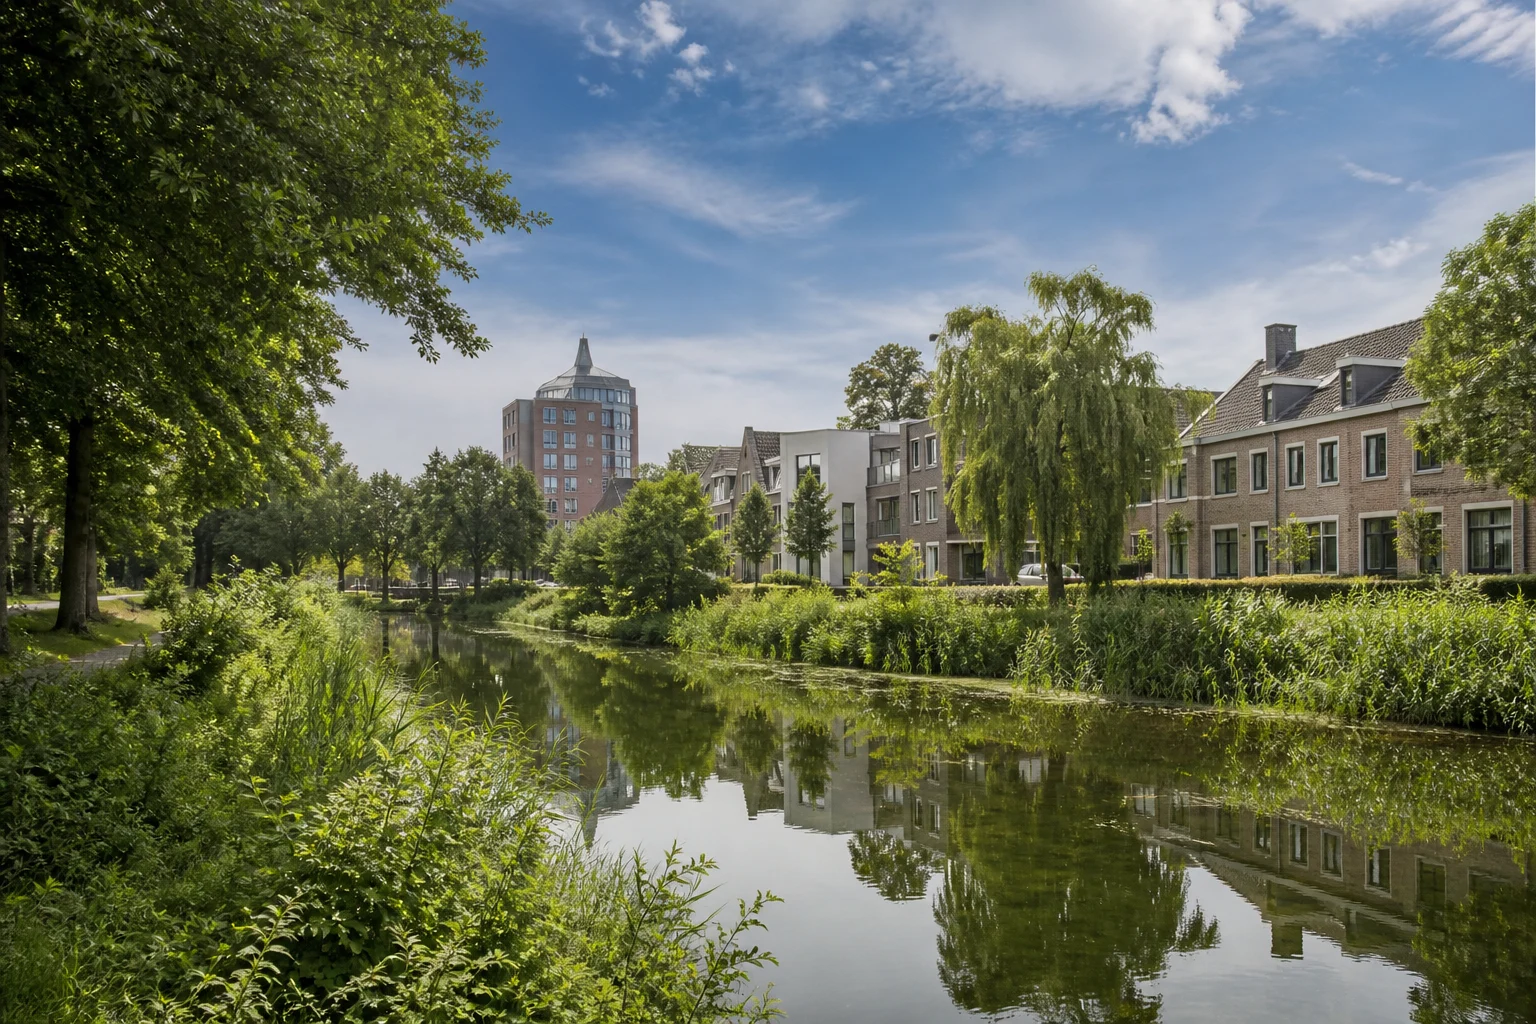
CBS recorded 96,551 residents, 43,914 households and 43,549 homes for Helmond municipality in 2025. The municipality is 72% single-family and 54% owner-occupied, compared with 63% and 57% nationally. The average WOZ value was €345,000 and residential density was 1,816 residents per km². District-level differences are wide: Dierdonk is 99% single-family and 97% owner-occupied, while Binnenstad is 41% single-family and 28% owner-occupied.
Best suited to: buyers who want a broad choice of urban, family and newer homes; Eindhoven and Brainport commuters; households comparing city-centre apartments with quieter family districts; families using Helmond’s schools, childcare and sport facilities; and international households that want English explanations alongside Dutch lender documents.
Less suitable if: you want one uniform market across the whole city, require a rural village setting at every address, or need a short walk to the same set of facilities regardless of district. Daily convenience, noise, parking, housing age and public-transport access vary materially between Helmond’s districts.
| Local profile | Helmond |
|---|---|
| Municipality / province | Helmond, Noord-Brabant |
| Population | 96,551 residents, CBS 2025 |
| Housing stock | 43,549 homes, CBS 2025 |
| Average WOZ | €345,000, CBS 2025 |
| Typical housing stock | 72% single-family homes; 28% multi-family homes |
| Tenure | 54% owner-occupied homes |
| Main buyer demand | Owner-occupiers, families, Eindhoven-area commuters, apartment buyers and new-build buyers |
| Character | Historic centre, established districts, newer neighbourhoods, canals, parks and green edges |
| Data boundary | Municipality contains twelve CBS districts; district and neighbourhood figures are not interchangeable |
Your next step in Helmond
Local property market
Helmond at a glance
The public market snapshot mixes different measures. Funda reports current listing activity and selling-time indicators. CBS reports housing stock, tenure, density and WOZ context. A valuation report uses the exact property, the stated purpose and completed comparable evidence.
| Indicator | Helmond | Period / definition |
|---|---|---|
| Homes for sale | 437 | Funda Helmond information snapshot, checked 22 August 2026 |
| Average asking price | €414,571 | Funda Helmond listing snapshot, same date |
| Average asking price per m² | €3,760 | Funda Helmond listing snapshot, same date |
| Average selling time | 22 days | Funda, based on its previous-12-month local measure |
| Homes sold previous 12 months | 1,016 | Funda Helmond information page, same snapshot |
| Average WOZ value | €345,000 | CBS municipality Helmond, 2025 assessed housing value |
| Population | 96,551 | CBS municipality Helmond, 1 January 2025 |
| Housing stock | 43,549 homes | CBS municipality Helmond, 2025 |
| Owner-occupied homes | 54% | CBS municipality Helmond, 2025 |
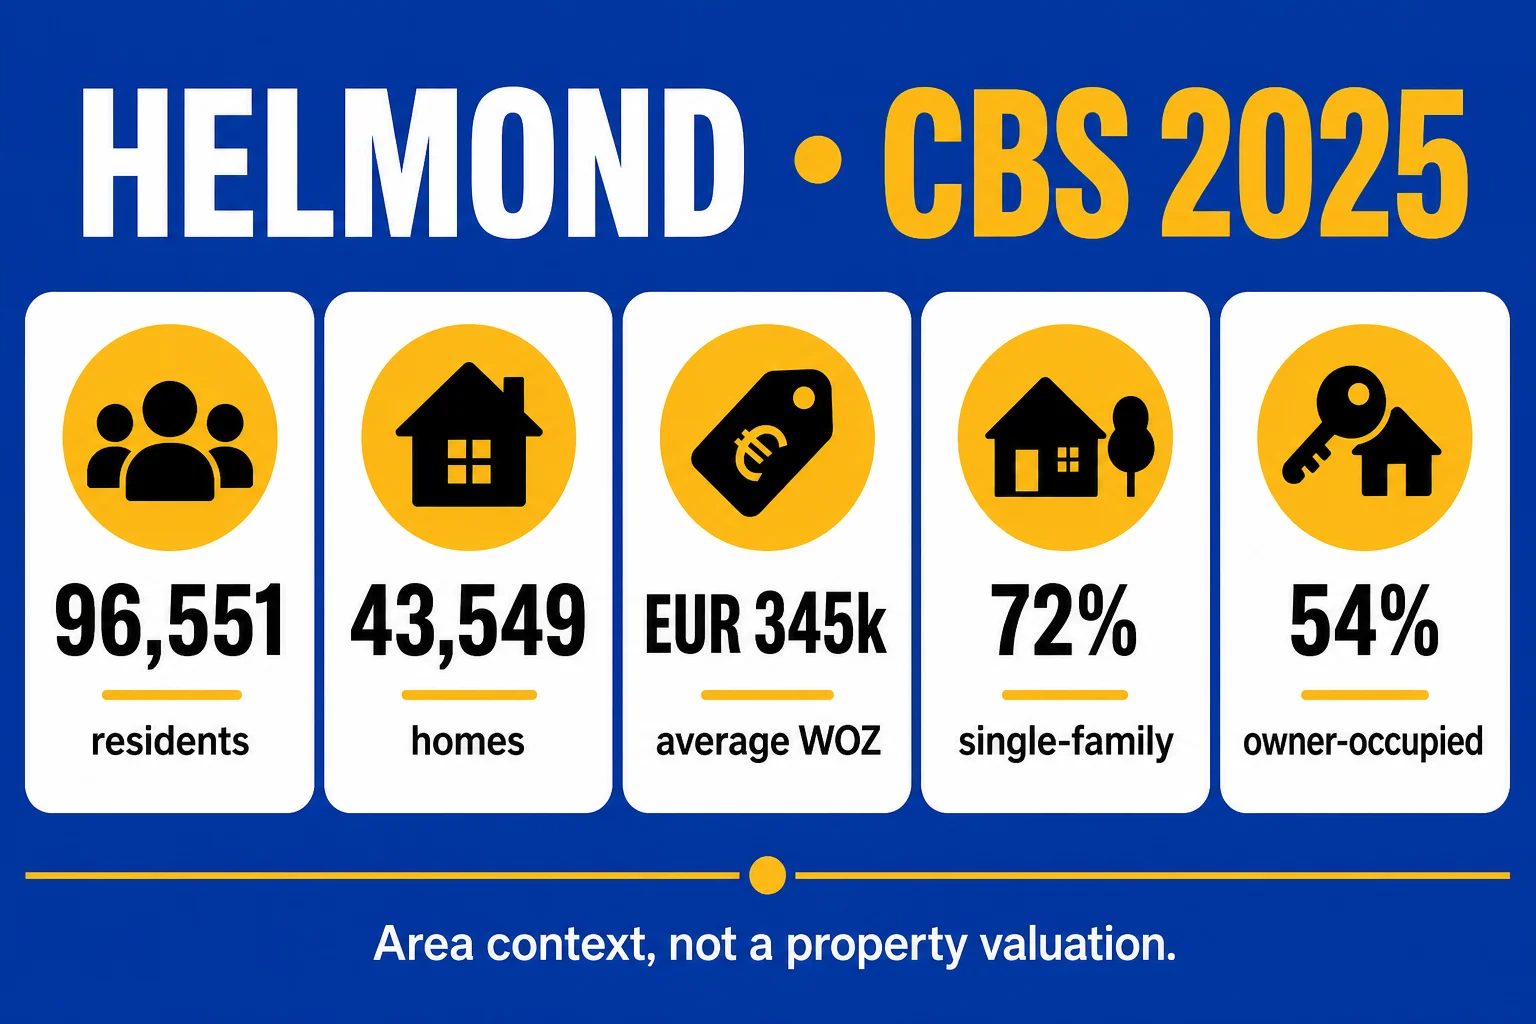
Funda’s figures are useful for understanding the current listing market, but they are not a transaction median. An asking-price average can move when the available mix contains more large detached homes or more apartments. The CBS WOZ figure is an assessed value for taxation and does not replace a current mortgage valuation.
Neighbourhood market snapshots
The Funda pages below were checked on 22 August 2026. They are local snapshots, not promises about a future listing or a fixed value for every home in the district.
| Funda area | Homes for sale | Average asking price | Asking €/m² | Selling time | Sold previous 12 months |
|---|---|---|---|---|---|
| Centrum | 26 | €302,619 | €4,207 | 28 days | 58 |
| Stiphout-Dorp | 19 | €612,452 | €4,138 | 25 days | 47 |
| Kern Dierdonk | 16 | €579,952 | €3,910 | 21 days | 50 |
| Brouwhuis-Dorp | 11 | €459,524 | €3,815 | 27 days | 48 |
| ’t Hout-Centrum | 4 | €423,333 | €3,834 | 23 days | 25 |
| Brand | 4 | €640,952 | €4,111 | 42 days | 20 |
| De Veste | 53 | €495,571 | €3,721 | 20 days | 48 |
| West | 9 | €339,500 | €3,716 | 20 days | 45 |
Centrum’s snapshot has a lower average asking price but more apartment and city-centre stock. Stiphout-Dorp and Kern Dierdonk show higher asking-price averages and predominantly family housing. De Veste has more listing volume in this snapshot, while Brand has a longer reported selling time. These differences are reasons to use comparable homes from the same setting, not reasons to assign a fixed premium to a district.
Recent Helmond asking examples
These Funda listing examples were visible in the Helmond search or a district page when checked on 22 August 2026. They demonstrate the spread of homes and asking prices; they are not completed-sale comparables.
| Listing example | Setting | Living area | Plot | Asking price | Energy label |
|---|---|---|---|---|---|
| Het Buske 23 | Stiphout | 118 m² | 151 m² | — | B |
| Kloosterstraat 54 | Stiphout | 138 m² | 259 m² | €529,000 | B |
| Dierdonklaan 28 | Dierdonk | 137 m² | 306 m² | €575,000 | B |
| Zonnedauwsingel 38 | Dierdonk | 146 m² | 364 m² | €595,000 | A |
| Holterbergweide 28 | Dierdonk | 172 m² | 696 m² | €820,000 | B |
| Kasteel-Traverse 84-K | Centrum apartment | 49 m² | — | €250,000 | A |
| Kasteel-Traverse 112 | Centrum apartment | 67 m² | — | €298,000 | C |
| Hertelaan 103 | Brouwhuis | 104 m² | 173 m² | €395,000 | A |
| Rivierensingel 170 | Brouwhuis | 131 m² | 230 m² | €425,000 | A |
| Tyboschplein 16 | Stiphout | 142 m² | 461 m² | €765,000 | A+++ |
For a mortgage valuation, the useful comparison is not just the asking number. The appraiser also considers living area, plot, construction period, condition, energy systems, legal position, outdoor space, parking, micro-location and relevant completed sales.
Housing form, plot and condition
| Home type or setting | CBS/local signal | What a valuer should compare |
|---|---|---|
| Detached home | Dierdonk is 99% single-family and Stiphout 90%; larger plots are more common in these districts | Plot, outbuildings, access, privacy, condition, energy performance and comparable sales |
| Semi-detached home | Common in Stiphout, Dierdonk, Brouwhuis and Brandevoort | Shared-wall position, extensions, plot, parking, insulation and neighbouring condition |
| Terraced or corner home | Common in Helmond-Noord, Rijpelberg, Brouwhuis and newer districts | Living area, garden, layout, renovation level, energy label and street setting |
| Apartment or other multi-family home | Binnenstad is 59% multi-family; Helmond-West is 42% | VvE documents, service costs, reserve fund, floor, lift, outdoor space and noise |
| New or recently improved home | Brandevoort and other growth areas include newer housing; official plans continue to add supply | Completion year, specification, energy systems, permits and market evidence |
Town setting and micro-location
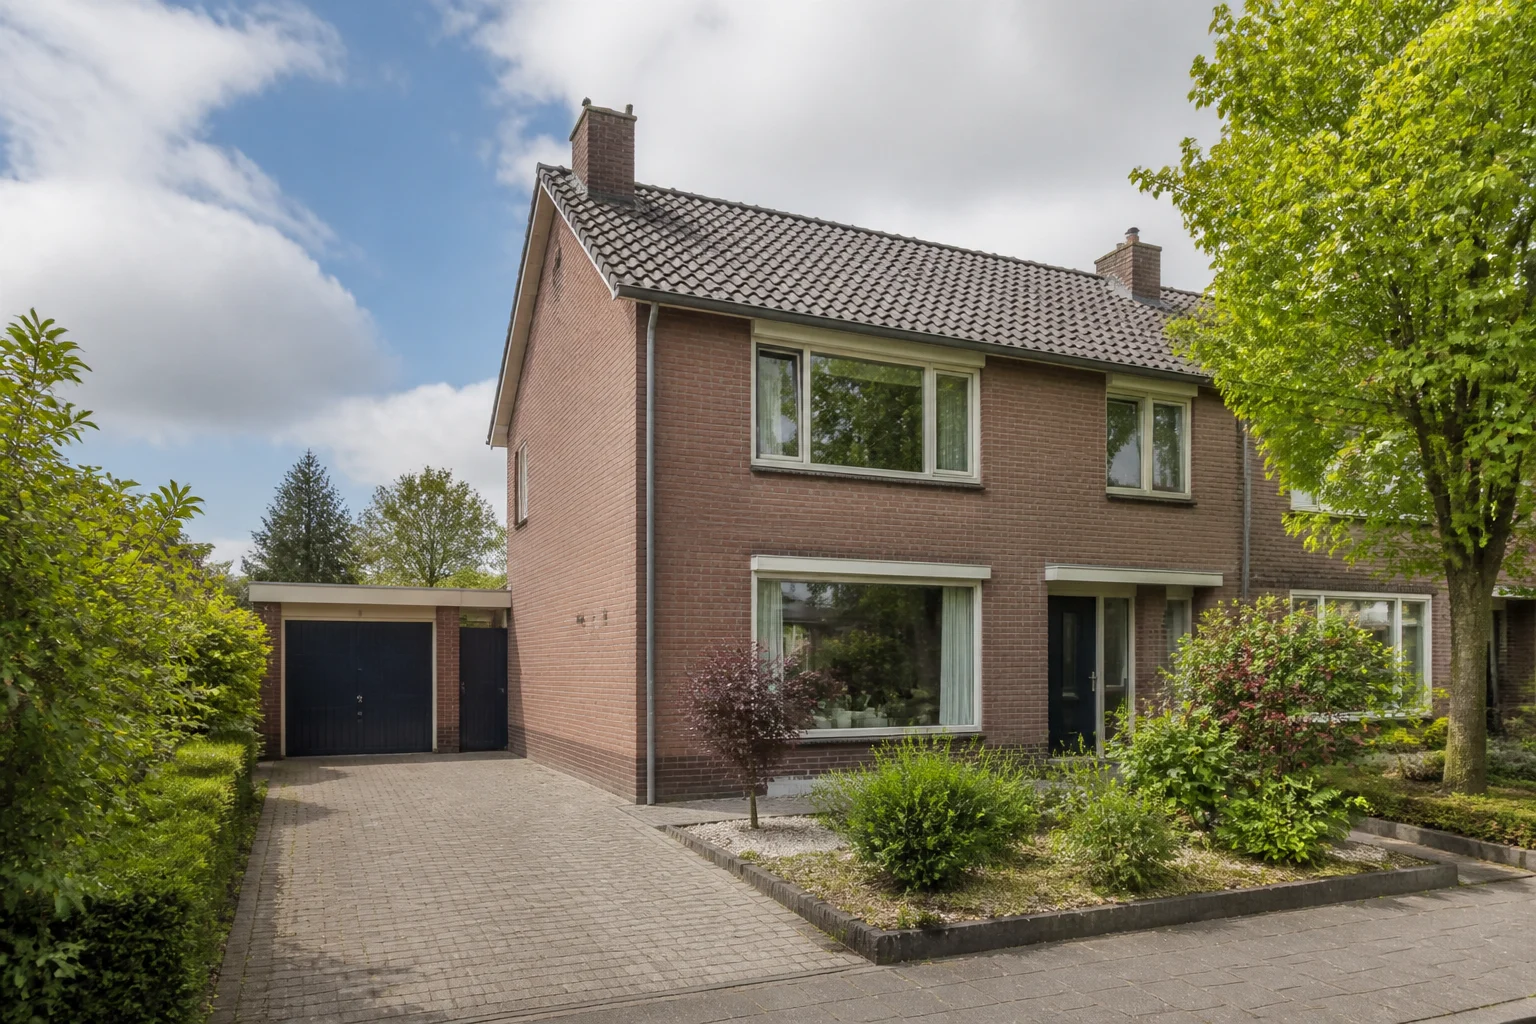
Binnenstad, Helmond-Oost, Helmond-Noord, ’t Hout, Brouwhuis, Helmond-West, Warande, Stiphout, Rijpelberg, Dierdonk and Brandevoort do not offer the same daily experience. A home near the centre or station may trade convenience for traffic and parking. A green-edge home may gain outlook and privacy but require more travel. A new-build street may offer energy efficiency while still having construction activity or incomplete landscaping. The valuation must distinguish those address-level factors.
| Value factor | Helmond question to check | Why it matters |
|---|---|---|
| Exact district | Is the home in the centre, an established family district, a newer district or a green edge? | Housing stock, density, services and comparable demand differ |
| Plot and garden | What is included in the title, and how usable is it? | Land, privacy, outbuildings and maintenance affect buyer appeal |
| Station or city access | How far is the home from Helmond, ’t Hout, Brandevoort or Brouwhuis station? | Travel convenience can matter while rail noise or parking can also matter |
| Access and parking | How do residents, visitors and deliveries reach the property? | Practical access and parking influence everyday use and marketability |
| Condition and improvements | Are extensions, insulation and installations documented? | Evidence supports the report and avoids a mismatch between claim and condition |
| Energy performance | Does the official label match the installed systems? | Energy costs, comfort and future work influence buyer decisions |
| Planning context | Is the home near a growth area, mobility project or green corridor? | New supply, construction activity and infrastructure can change the setting |
Market outlook
Base case for the next 12–24 months: Helmond’s housing market is likely to remain sensitive to Eindhoven and Brainport employment, borrowing capacity, the mix of apartments and family homes, and the pace of planned growth. The municipality has been designated a large-scale housing location and wants additional homes alongside jobs, facilities, green space and mobility. Delivery, design, interest rates and buyer demand can change, so this is context rather than a price prediction.
| Driver | Local evidence | Possible effect | Confidence |
|---|---|---|---|
| Eindhoven and Brainport employment | Helmond is connected to Eindhoven and the wider regional employment base | Supports demand for homes with workable city access | Medium |
| District-level housing mix | Dierdonk and Stiphout are mainly owner-occupied family areas; Binnenstad has more multi-family stock | Buyers may value the exact housing type and location differently | High |
| Planned housing and jobs | Helmond’s housing vision and 2040 ambition link growth to jobs, facilities, green and mobility | More supply may broaden choice; construction timing and type matter | Medium |
| Borrowing capacity | Buyers remain sensitive to monthly mortgage costs and lender criteria | Can limit budgets even when asking prices remain firm | Medium |
| Energy performance | Older city stock sits alongside newer Brandevoort and renovated homes | Strong performance can support marketability and running-cost expectations | Medium |
| Mobility and public space | The mobility vision gives more priority to walking, cycling and public transport | Street design, parking and travel patterns may evolve | Medium |
Living in Helmond
Everyday character
Helmond offers more urban variety than the smaller villages south and east of Eindhoven. The centre has shops, apartments, cultural venues and the main rail station. Stiphout, Dierdonk, Brouwhuis, Rijpelberg and Brandevoort provide more family-oriented streets, while Warande combines larger homes with green surroundings. Canals, parks and the Berkendonk recreation area add outdoor options, but the best daily fit still depends on the exact address.
Expat suitability
Expat fit: medium to high for households that want a wider housing choice near Eindhoven and can plan Dutch administration and transport. Helmond’s English municipal information and regional employment connections are useful, but mortgage documents, school admissions, property records and lender requirements remain largely Dutch. Cheetah Valuations can explain the process in English while keeping the formal Dutch wording visible.
| Expat consideration | Helmond context | Practical implication |
|---|---|---|
| International employment | Eindhoven, High Tech Campus and the wider Brainport region are reachable from Helmond | Check the exact office location and peak-hour journey |
| English information | The municipality publishes English city information while many formal documents remain Dutch | Keep Dutch lender and property terms visible |
| Housing choice | The city has apartments, terraced homes, family districts and newer Brandevoort stock | Compare housing type, VvE, plot, energy and maintenance differences |
| Schools | Helmond has 26 primary schools and seven secondary-school locations | Confirm admissions, language support, catchment and childcare directly |
| Transport | Four rail stations serve different districts, with bus and cycling connections | Check first- and last-mile travel from the exact home |
| Services | The centre, district centres and neighbourhood facilities offer different levels of convenience | Match the address to your household’s weekly routine |
Families and children
Family suitability
Family fit: high where households choose a district with the right school, childcare and outdoor routine. Helmond’s education-housing vision records 26 primary schools with 7,669 pupils and seven secondary-school locations with 5,541 pupils (DUO reference date 1 October 2023). The municipality also works with childcare, sport and neighbourhood facilities; the journey, admissions process and after-school availability should be checked from the exact address.
| Family factor | Helmond context | Buyer relevance |
|---|---|---|
| Primary schools | 26 primary schools across the city, with district-level differences | Nearby school supports routine; confirm admissions and school arrangements |
| Secondary schools | Seven secondary-school locations | Compare school level, cycle journey and public-transport connection |
| Childcare | CBS 2025 municipality average is about 0.6 km to childcare; district values vary | Availability and opening times can change; ask providers directly |
| School distance | CBS 2025 municipality average is about 0.7 km to a primary school | A short average distance can still include crossings or busy roads |
| Housing supply | 72% of municipality homes are single-family, with higher shares in Dierdonk and Stiphout | More family space in some districts, but prices and plot sizes vary |
| Sport and play | District facilities, sport halls and Berkendonk provide varied activities | Check the facilities and schedules that fit your household |
| Neighbourhood facilities | The Rijpelberg multifunctional accommodation combines education, childcare, sport and care | A nearby hub can simplify routines; confirm opening hours and provision |
Safety and liveability
Safety context
The CBS registered-crime table reports 4,475 registered crimes in Helmond municipality in 2025, or 46.4 per 1,000 residents. This is recorded-crime context, not a promise about a street or a forecast. A city-wide figure cannot describe every district, so combine public information with an address visit and normal local checks.
| Measure | Helmond | Period / definition |
|---|---|---|
| Registered crimes | 4,475 incidents | CBS, municipality Helmond, 2025 preliminary |
| Registered-crime rate | 46.4 per 1,000 residents | CBS, municipality Helmond, 2025 preliminary |
| Street-level experience | Check lighting, footfall, parking, crossings and traffic | Exact-address observation, not a statistical score |
| Evening journey | Compare the actual walk or cycle from station, parking, school or bus | Conditions vary by time, weather and season |
Safety for internationals and women
Recorded incidents do not describe how every resident experiences every street. If evening travel matters, check lighting near the home, sightlines, cycle continuity, station access and door security. International households should keep emergency information and municipal contacts in a language they understand. Women, families and anyone cycling after dark should assess the exact journey at the time it will be used.
Liveability and environmental quality
Helmond’s official 2040 vision, green-and-healthy landscape vision and mobility vision address green corridors, traffic, noise, air, water, climate, walking, cycling and external safety. Canals, parks and Berkendonk support outdoor life, while industrial areas, busy roads, construction, drainage and maintenance remain address-specific.
| Factor | Helmond context | What to check |
|---|---|---|
| Green structure | The municipality’s green vision links parks, canals and corridors to cooling, water and recreation | Is the outlook public, private or affected by a plan? |
| Density | Municipality averages 1,816 residents per km²; Binnenstad is 6,066 and Stiphout 510 | Higher density can mean convenience; lower density can mean more travel |
| Traffic and noise | Mobility policy prioritises safer walking and cycling while roads remain important for access | Check road noise, parking pressure, cycling safety and construction timing |
| Water and climate | Canals, green corridors and public-space plans address rainwater and heat | Confirm drainage, groundwater and plot-level conditions |
| Energy performance | Older city stock sits alongside newer and renovated homes | Confirm the official label and installed systems |
| Industrial interface | Hoogeind and BZOB have different land uses from residential districts | Check noise, traffic, air and future planning around the address |
Getting around
Walking and cycling
Helmond’s centre and district hubs provide the strongest everyday-service concentration, while Dierdonk’s larger homes and green edges can require a longer trip. CBS 2025 proximity averages place a large supermarket about 0.8 km, a primary school 0.7 km, childcare 0.6 km and a GP 0.8 km from homes in the municipality. District averages differ: Dierdonk’s large-supermarket distance is about 2.1 km, while Binnenstad’s is about 0.4 km.
| Destination | CBS 2025 municipality average | Practical note |
|---|---|---|
| Large supermarket | 0.8 km | Districts differ materially; check the actual weekly shop |
| Primary school | 0.7 km | A short distance can still include crossings or busy roads |
| Childcare | 0.6 km | Places and opening times need direct confirmation |
| GP | 0.8 km | Healthcare access varies with the neighbourhood and provider |
| Rail station | Served by four stations | Check the live journey from the exact home and the station you will use |
Public transport and rail
Helmond has four rail stations: Helmond, Helmond ’t Hout, Helmond Brandevoort and Helmond Brouwhuis. The NS passenger information and published timetable material show the stations as part of the regional rail network. Bus services connect districts to the centre and station areas, but schedules, works and holiday services change. Check the live departure information for the journey you actually make.
Employment and regional access
| Destination | Why it matters | What to check |
|---|---|---|
| Eindhoven city | Main nearby employment, services and rail reference point | Exact office, peak traffic, parking and public-transport transfers |
| High Tech Campus | Important regional employment anchor west of Eindhoven | Door-to-door time from the actual street |
| Helmond employment areas | Helmond has its own jobs, city services and industrial areas | Check noise, traffic and the household’s normal schedule |
| A67, A50 and N279 | Regional road connections for Eindhoven, Venlo, ’s-Hertogenbosch and beyond | Live congestion, road works and parking at the destination |
| Rail stations | Four local stations create different first-mile options | Test the walk or cycle and late-evening connection |
Helmond is well placed for households working in Eindhoven or within the city, but the best address depends on when and how each person travels. Test the journey in the same time window that you will use after moving.
Amenities and leisure
Daily essentials
The city centre has the broadest shopping and cultural offer. Brouwhuis, Rijpelberg, Brandevoort and other districts have neighbourhood facilities, schools and local services, while the green edges trade some convenience for space and outlook. A home near shops or a station can save travel time but may have more traffic, parking or activity. A quieter edge can require more planning for routine services.
Recurring events and local perks
The city’s events and recreation information covers sport, culture and local activities. Berkendonk provides a public recreation area east of the city, while sport facilities and the city centre add indoor and cultural options. Helmond’s canals, parks and green corridors support walking and cycling. Check current calendars, access and opening times rather than assuming a facility is available every day.
Costs beyond the price
The purchase price is only one part of a Helmond housing decision. Budget for transfer tax or other purchase costs, mortgage advice, notary work, inspection, insurance, energy, maintenance, moving and any VvE charge. Municipal and water-board charges depend on the property and current tariff year; confirm the amount directly before relying on a budget.
For a standard Cheetah Valuations residential valuation in the normal service area, the current fee is €599 all-in, including VAT, NWWI validation, cadastral research and normal-area travel. After the inspection, the report is normally delivered within 48 hours when access, documents and agreed requirements are complete. A 24-hour option costs €60 extra. Calls are available 09:00–21:00, seven days a week, and the online form is available 24/7. Confirm the exact report type and lender wording before booking.
Neighbourhoods within Helmond
| District | CBS 2025 residents | Homes | Average WOZ | Single-family | Owner-occupied | Local reading |
|---|---|---|---|---|---|---|
| Binnenstad | 17,460 | 9,288 | €267,000 | 41% | 28% | Dense centre with apartments, shops, services and varied street activity |
| Helmond-Oost | 7,905 | 3,830 | €234,000 | 55% | 30% | Established mixed housing with relatively high density |
| Helmond-Noord | 12,290 | 5,434 | €276,000 | 74% | 44% | Family housing and district facilities with planned change nearby |
| ’t Hout | 11,175 | 4,856 | €352,000 | 88% | 65% | Strong single-family base and local village-centre character |
| Brouwhuis | 9,145 | 4,038 | €326,000 | 88% | 63% | Family district with station access and varied sub-areas |
| Helmond-West | 4,730 | 2,396 | €275,000 | 58% | 37% | Established west-side housing with mixed tenure |
| Warande | 3,065 | 1,352 | €607,000 | 83% | 84% | Lower-density, higher-value green-edge setting |
| Stiphout | 5,640 | 2,403 | €540,000 | 90% | 82% | Village character, large family homes and strong owner occupation |
| Rijpelberg | 8,145 | 3,485 | €296,000 | 86% | 69% | Family district with green recreation and neighbourhood facilities |
| Dierdonk | 4,785 | 1,729 | €539,000 | 99% | 97% | Predominantly owner-occupied single-family housing |
| Brandevoort | 11,905 | 4,620 | €509,000 | 84% | 76% | Newer planned district with station, varied streets and continuing growth |
| Industriegebied Zuid | 305 | 118 | €356,000 | 87% | 68% | Small mixed-use statistical area; check land use and surroundings carefully |
The CBS values describe statistical areas, not the value of an individual home. Within each district, plot, condition, street, energy performance, legal position and completed comparable sales can create a large spread.
Is Helmond a good place to buy?
Helmond can be a strong fit if you want a broad choice of homes near Eindhoven, city services, local schools, four rail stations and green recreation. Dierdonk, Stiphout, Brouwhuis, ’t Hout and Brandevoort may suit households looking for family housing, while Binnenstad and Helmond-West offer more mixed and apartment stock. The main compromises are district-level variation, traffic and parking, Dutch administrative paperwork, and the fact that growth and infrastructure can change a local setting.
Before making an offer, compare the exact street with the report purpose. Check the home’s condition, plot and energy evidence; confirm the lender’s NWWI or other report requirement; test the school and work journeys; and review nearby housing, mobility or public-space plans that could affect access or outlook.
Before you rely on a valuation
An online estimate, asking price, WOZ value and mortgage valuation are not interchangeable. A mortgage report considers the individual property, valuation date, stated purpose, comparable completed sales, documents and inspection findings. The lender decides whether the report satisfies its mortgage process.
Prepare the full address, purchase agreement or mortgage request, adviser wording, deadline, floor plans, energy label, renovation evidence, permits, VvE documents where relevant, and any known access or title issue. If a file is incomplete, name the missing document early so the appointment and report timing can be planned honestly.
How to use these figures
CBS figures in this guide use the 2025 Wijken en Buurten dataset and the boundaries shown in that dataset. Funda numbers are listing snapshots checked on 22 August 2026; they can change as listings are added, withdrawn or sold. Municipal planning and transport statements describe current published plans and services, not guaranteed delivery or fixed journey times. Recheck the exact address and current source information before making a financial decision.
Compare Helmond with nearby towns
Property valuation guide for Valkenswaard
The Valkenswaard snapshot recorded an average asking price of €443,238 at €4,180 per m².
The Helmond snapshot recorded an average asking price of €414,571 at €3,760 per m².
Valkenswaard showed an average selling time of 21 days from 443 homes sold in the previous 12 months. Helmond showed an average selling time of 22 days from 1016 homes sold in the previous 12 months.
In the 2025 CBS context, Valkenswaard records an average WOZ value of €419,000, 75% single-family homes. In the 2025 CBS context, Helmond records an average WOZ value of €345,000, 72% single-family homes, 54% owner-occupied homes.
Valkenswaard is higher on both the asking total and asking price per m² than Helmond. The Valkenswaard sample also moved about 1 day faster. Match the exact address, property type, plot, condition, energy performance and report purpose before using either headline as a comparable.
Property valuation guide for Eersel
The Eersel snapshot recorded an average asking price of €491,667 at €4,166 per m².
The Helmond snapshot recorded an average asking price of €414,571 at €3,760 per m².
Eersel showed an average selling time of 24 days from 124 homes sold in the previous 12 months. Helmond showed an average selling time of 22 days from 1016 homes sold in the previous 12 months.
In the 2025 CBS context, Eersel records an average WOZ value of €457,000, 81% single-family homes, 70% owner-occupied homes. In the 2025 CBS context, Helmond records an average WOZ value of €345,000, 72% single-family homes, 54% owner-occupied homes.
Eersel is higher on both the asking total and asking price per m² than Helmond. The Eersel sample moved about 2 days slower. Match the exact address, property type, plot, condition, energy performance and report purpose before using either headline as a comparable.
Property valuation guide for Bergeijk
The Bergeijk snapshot recorded an average asking price of €507,476 at €3,864 per m².
The Helmond snapshot recorded an average asking price of €414,571 at €3,760 per m².
Bergeijk showed an average selling time of 25 days from 158 homes sold in the previous 12 months. Helmond showed an average selling time of 22 days from 1016 homes sold in the previous 12 months.
In the 2025 CBS context, Bergeijk records an average WOZ value of €477,000, 86% single-family homes, 78% owner-occupied homes. In the 2025 CBS context, Helmond records an average WOZ value of €345,000, 72% single-family homes, 54% owner-occupied homes.
Bergeijk is higher on both the asking total and asking price per m² than Helmond. The Bergeijk sample moved about 3 days slower. Match the exact address, property type, plot, condition, energy performance and report purpose before using either headline as a comparable.
Relevant guides and next step
If you are comparing nearby places, start with the Sterksel property valuation guide, the Heeze property valuation guide or the Waalre property valuation guide. For the report itself, review the services and prices and request a mortgage valuation.
To compare this area with nearby towns and neighbourhoods, visit the Eindhoven property valuation comparison hub.
FAQ
What is the property valuation context in Helmond?
Helmond’s valuation context combines a city-wide average with major differences between twelve districts. Binnenstad has more multi-family and rental housing, while Dierdonk and Stiphout are mainly owner-occupied single-family areas. The exact home, documents, purpose and comparable completed sales still determine an individual report.
What are current house prices in Helmond?
The Funda Helmond snapshot checked on 22 August 2026 showed an average asking price of €414,571 and €3,760 per m², with 437 homes for sale. This is a listing-market indicator, not a completed-sale median or a promise about the price of a particular home.
How does WOZ value differ from market value?
CBS reports an average Helmond municipal WOZ value of €345,000 for 2025. WOZ is an assessed value for taxation. A mortgage valuation is a professional report for an individual property, purpose and valuation date.
Which Helmond district is best for families?
Stiphout, Dierdonk, Brouwhuis, ’t Hout, Rijpelberg and Brandevoort all have family-oriented housing, but the best fit depends on the exact street, school arrangements, childcare, budget, traffic and work journeys. Check admissions and the daily journey directly rather than relying on a district label.
Does Helmond suit international buyers?
It can suit international buyers who want a wider housing choice near Eindhoven and are comfortable arranging Dutch property and mortgage documents. Cheetah Valuations provides English explanations while keeping formal Dutch lender wording visible.
Which documents should I prepare for a Helmond valuation?
Prepare the full address, purchase agreement or mortgage request, adviser wording, deadline, floor plans, energy label, renovation invoices, permits and inspection information. Apartment buyers should also provide VvE documents, service costs and maintenance plans when relevant.
How do Helmond homes differ between districts?
CBS 2025 shows single-family shares from 41% in Binnenstad to 99% in Dierdonk. Owner occupation ranges from 28% in Binnenstad to 97% in Dierdonk. Those differences affect comparable selection, buyer demand and the evidence needed for the report.
What are Helmond’s housing and area plans?
Helmond has been designated a large-scale housing location and its municipal plans connect additional homes with jobs, facilities, green space and mobility. The pace, design and exact location of development can change, so check the current municipal pages for a property-specific decision.
Are shops and healthcare close in Helmond?
CBS 2025 municipality averages are about 0.8 km to a large supermarket, 0.7 km to a primary school, 0.6 km to childcare and 0.8 km to a GP. District averages vary; use the exact address and current provider information for a real decision.
Can I reach Eindhoven without a car?
Helmond has four rail stations—Helmond, Helmond ’t Hout, Helmond Brandevoort and Helmond Brouwhuis—plus bus and cycling connections. Check a live planner for your street, destination, day and time because schedules, works and holiday service can change.
What does a standard valuation cost?
Cheetah Valuations’ standard residential valuation is €599 all-in in the normal service area, including VAT, NWWI validation, cadastral research and normal-area travel. Confirm the report type and lender requirements before booking.
How quickly can the report be delivered?
After the inspection, a complete standard file is normally delivered within 48 hours. A 24-hour option is available for €60 extra. Timing depends on access, documents and the agreed report requirements.
When can I speak to the appraiser?
Calls are available from 09:00 to 21:00 seven days a week. The online request form is available 24/7, so you can send the address, purpose, lender wording and deadline when convenient.
What should I check before buying in Helmond?
Check the exact district, home type, plot and title, energy evidence, parking, noise, school or work journey, nearby plans and the lender’s report requirement. A city-wide asking-price average cannot answer those property-specific questions.